
Figure 3.
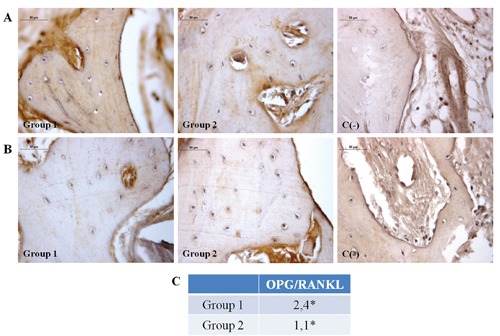
A) Immunohistochemical analysis of OPG expression in Group 1 and Group 2 specimens. Moderate OPG immunolabeling in Group 1 and weak OPG immunolabeling in Group 2 bone tissue; no OPG immunostaining is seen in negative control. B) Immunohistochemical analysis of RANKL expression, in Group 1 and Group 2 specimens, respectively. Magnification 40x. Group 1: bone tissue specimens obtained from equine-derived bone substitute grafted area; Group 2: bone tissue specimens obtained from calvaria bone grafted area; C(-), negative control. Weak RANKL immunolabeling in both Group 1 and Group 2 bone tissue; no RANKL immunostaining is seen in negative control. C) OPG/RANKL ratio values; *P<0.05.