
Figure 4.
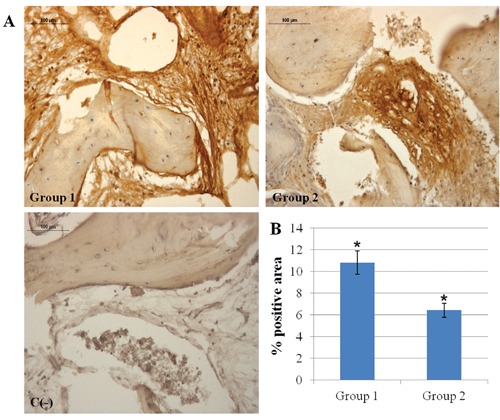
A) Immunohistochemical analysis of VEGF expression in Group 1 and Group 2 specimens. Magnification 20×. Group 1: bone tissue samples obtained from equinederived bone substitute grafted area; Group 2: bone tissue specimens obtained from calvaria bone grafted area; C(-), negative control. Very strong VEGF immunolabeling in Group 1 and strong VEGF immunolabeling in Group 2 bone tissue; no VEGF immunostaining is seen in negative control. B) Graphic representation of densitometric analysis of VEGF positive area ± SD determined by direct visual counting of ten fields (mean values) for each of five slides per specimens at 20× magnification (*P<0.05).