
Figure 1.
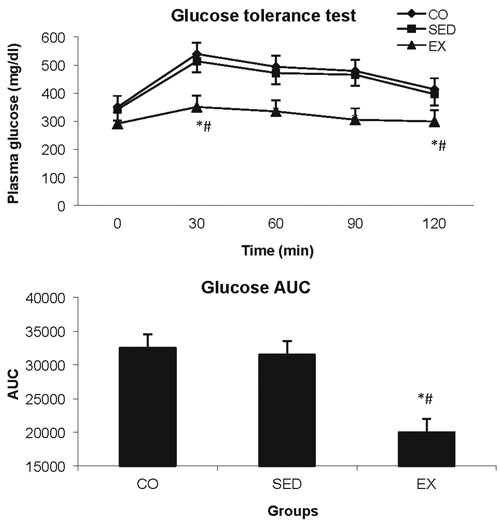
Glucose tolerance test results and the area under the curve (AUC) using the trapezoid rule. Comparisons were performed at each time point using one-way ANOVA, post-hoc Tuckey test. *P<0.05, exercise (EX) compared to control (CO) group; #P<0.05, EX compared to sedentary (SED) group.