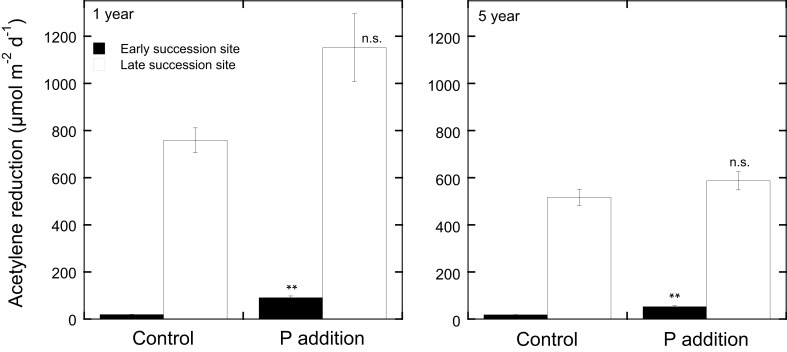
Figure 3.
Acetylene reduction rates (μmol m−2d−1) in Pleurozium schreberi at one late (open bars) and one early (filled bars) succession forest site in northern Sweden in response to P additions (5 kg P ha−1 yr−1 as NaH2PO4). Shown are acetylene reduction rates measured 1 and 5 years after the P additions. Phosphorus was applied annually to 10 replicate 1.0 m2 plots in four doses over the course of the summer. Distilled water was applied to the control plots. Mean values (n = 10) and +1 SE are given, **represents significant at P < 0.05 and n.s. represents not significant as determined by a One-Way ANOVA. Experimental design, sampling, and data analyses are reported for year-one in Zackrisson et al. (2004).

