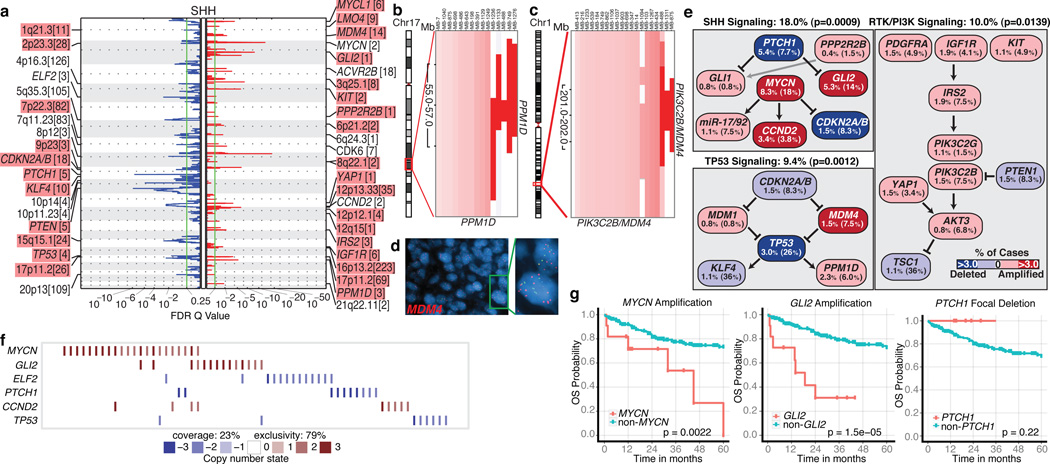
Figure 2. Genomic alterations affect core signaling pathways in SHH medulloblastoma.
a, GISTIC2 significance plot of amplifications (red) and deletions (blue) observed in SHH. The number of genes mapping to each significant region are included in brackets and regions enriched in SHH are shaded red. b, c, Recurrent amplifications of PPM1D (b) and PIK3C2B/MDM4 (c) are restricted to SHH. d, FISH validation of MDM4 amplification. e, SHH signaling, TP53 signaling, and RTK/PI3K signaling represent the core pathways genomically targeted in SHH. P-values indicate the prevalence with which the respective pathway is targeted in SHH vs. non-SHH cases (Fisher’s exact test). Frequencies of focal and broad (parentheses) SCNAs are listed. f, Mutual exclusivity analysis of focal SCNAs in SHH. g, Clinical implications of SCNAs affecting MYCN, GLI2, or PTCH1 in SHH (log-rank tests).

