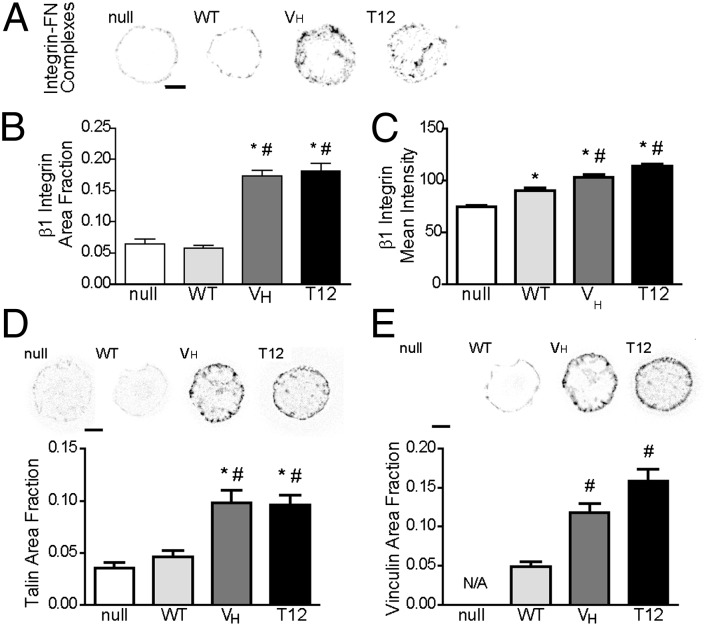
Fig. 4.
Vinculin head–tail interaction regulates integrin–FN complexes and FA assembly. (A) Immunostaining for β1 integrin for cells adhering to FN micropatterned islands. Staining is shown as grayscale on white background to facilitate visualization. (Scale bar, 5 µm.) (B) Fraction of adhesive area occupied by integrin–FN complexes. ANOVA P < 0.0001, *P < 0.05 vs. null, #P < 0.05 vs. WT. (C) Intensity of integrin staining over micropatterned area. ANOVA P < 0.0001, *P < 0.05 vs. null, #P < 0.05 vs. WT (>60 cells per condition). (D) (Upper) Immunostaining for talin for cells adhering to FN islands. (Scale bar, 5 µm.) (Lower) Area of talin staining normalized to total adhesive area. ANOVA P < 0.0001, *P < 0.05 vs. null, #P < 0.05 vs. WT. (E) (Upper) Immunostaining for vinculin for cells on FN islands (Scale bar, 5 µm.) (Lower) Area of vinculin staining normalized to total adhesive area. ANOVA P < 0.0001, *P < 0.05 vs. null, #P < 0.05 vs. WT (>20 cells per condition).

