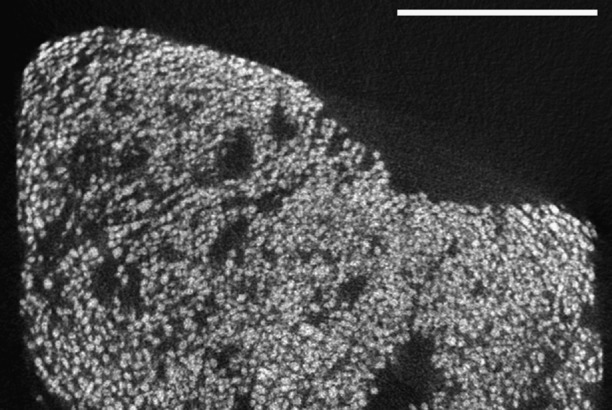
Fig. 4.

Micro-CT scan of FLEC core taken from a Highborne Cay thrombolitic mat. Note that the microfabric of this thrombolitic mat is similar to that shown in Fig. 3 (see especially Fig. 3D, Right), which was a strombolitic mat exposed to foraminiferal activity. Core was oriented to show cross section bisecting the sediment–water interface. (Scale bar: 5 mm.)
