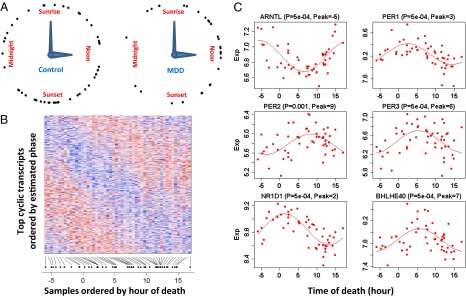
Fig. 1.

Discovery of cyclic gene expression in the human brain: examples from the DLPFC. (A) TOD distribution in the controls (n = 52) and patients with MDD (n = 33 in the DLPFC). TODs (zeitgeber time, ZT) were individually adjusted by sunrise time. (B) Heat map of expression levels for top (P < 0.05) cyclic genes (n = 922) in DLPFC samples of 52 control subjects. Genes are shown in the vertical direction and ordered by inferred phase, and samples are shown along the horizontal direction and ordered by ZT across the 24-h day, where sunrise time is ZT = 0. Expression levels for each gene are rescaled by its observed SD. The color scale represents 0.25-fold to fourfold of SD. Red indicates higher expression, and blue indicates lower expression. (C) Expression (Exp) levels of six known circadian genes in samples ordered by TOD. P values and peak times are indicated above each panel. The red lines depict the best-fitting sinusoidal curves.
