Fig. 2.
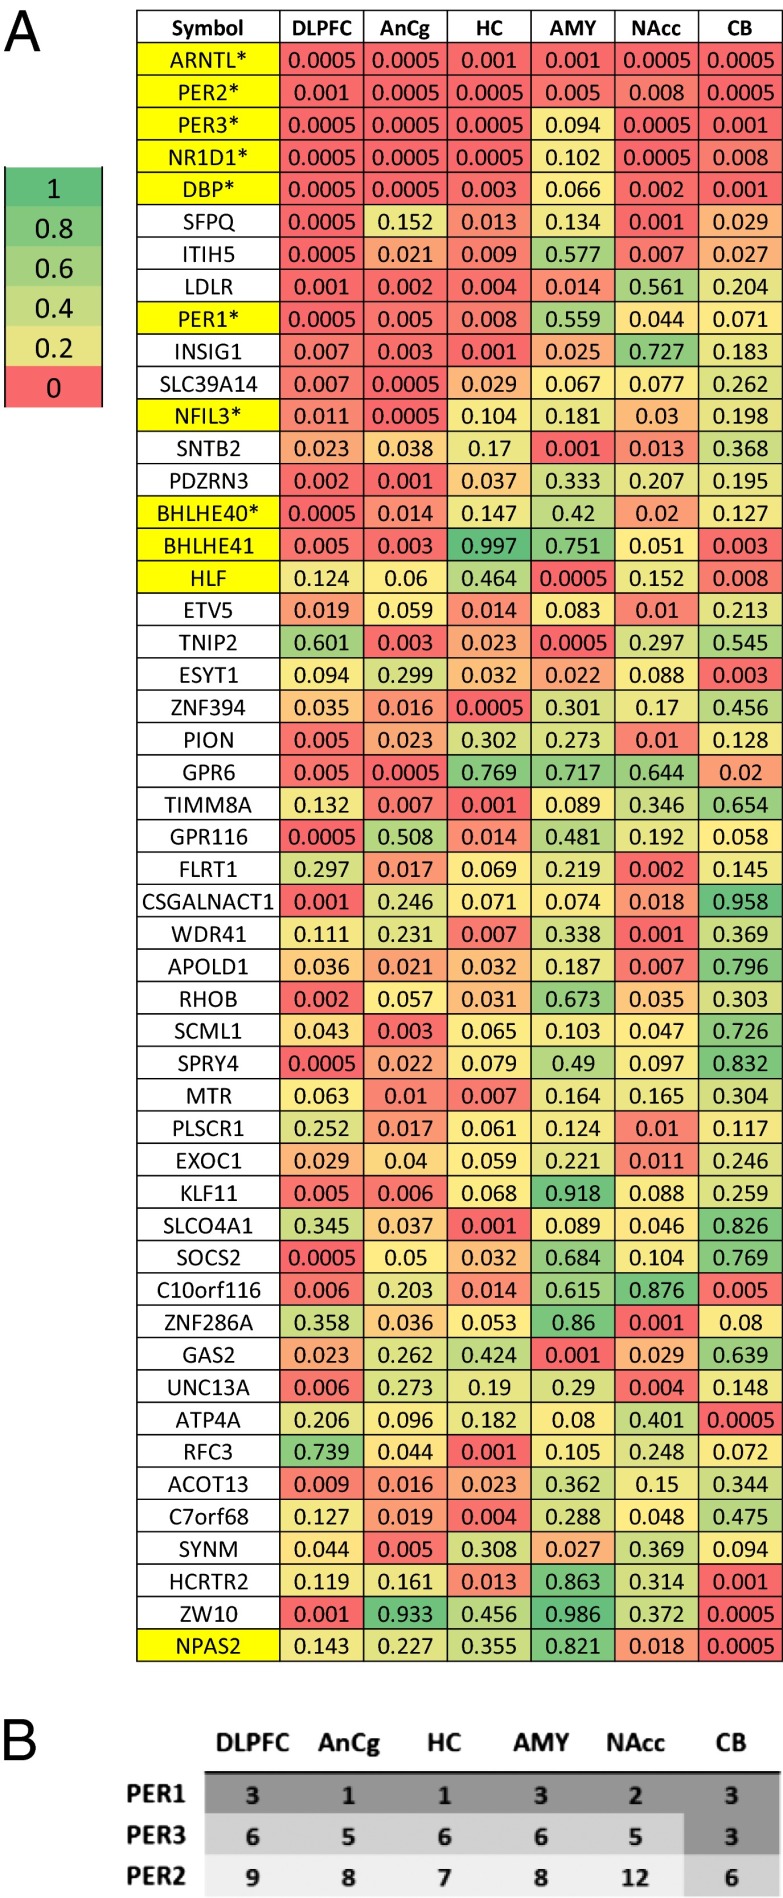
Characterization of the top cyclic genes in the human brain. (A) Comparison of statistical significance for the top cyclic genes across regions. Shown are P values of the top 50 genes across six regions, with the genes ordered by the average logged P value across the six regions. The 11 gene symbols that are highlighted in yellow were annotated as being part of the circadian rhythm pathway in the Kyoto Encyclopedia of Genes and Genomes (KEGG) or the Protein Information Resource (PIR). Among the 41 “core circadian genes” reviewed by Yan et al. (5), 38 were on the microarray platform used in our study and 8 (marked by *) overlapped with the 50 genes shown here. In addition, 5 genes among the 38 (TFRC, NAMPT, USP2, NR1D2, and CRY1) ranked among the top 5% in our study (ranked at 0.7%, 0.7%, 1.3%, 1.6%, and 4.2%, respectively). (B) Peak time of expression for PER genes in our study follows what might be predicted by the animal literature. PER1 expression peaks 0–2 h after sunrise, PER2 peaks in the afternoon, and PER3 peaks in the interval between PER1 and PER2 in all six brain regions.

