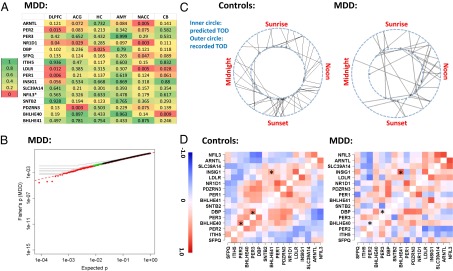
Fig. 4.

Disruption of cyclic pattern in patients with MDD. (A) Top 16 cyclic genes from controls are not rhythmic in the MDD group. The P values for the genes are formatted similar to Fig. 2A (ranked by the average logged P value across the six regions in controls). (B) Genes in patients with MDD do not exhibit consistently significant rhythmicity, as illustrated by a quantile–quantile plot comparing the combined P values across the six brain regions in MDD (using Fisher’s method) vs. the expected P values in a uniform distribution using the same style as in Fig. 3A. (C) Rhythms of patients with MDD are less synchronized with the solar day compared with controls. The predicted TOD in 55 controls (Left) and 34 patients with MDD (Right) are shown on the inner circle of a 24-h clock, and their documented TODs are shown on the outer circle. The deviations were smaller in controls than in patients with MDD (P = 0.012, Mann–Whitney nonparametric test). (D) Patterns of gene-gene correlations seen in controls (in-phase = positive correlation, out-of-phase = negative correlation) are only partially present in patients with MDD. Depicted are the correlation coefficients across the top 16 genes, calculated using DLPFC data for 52 controls (Left) and 33 MDD cases (Right). Genes are ordered by the peak time derived from the control dataset. Examples of gene pairs with significant differences between controls and patients with MDD are marked with an asterisk.
