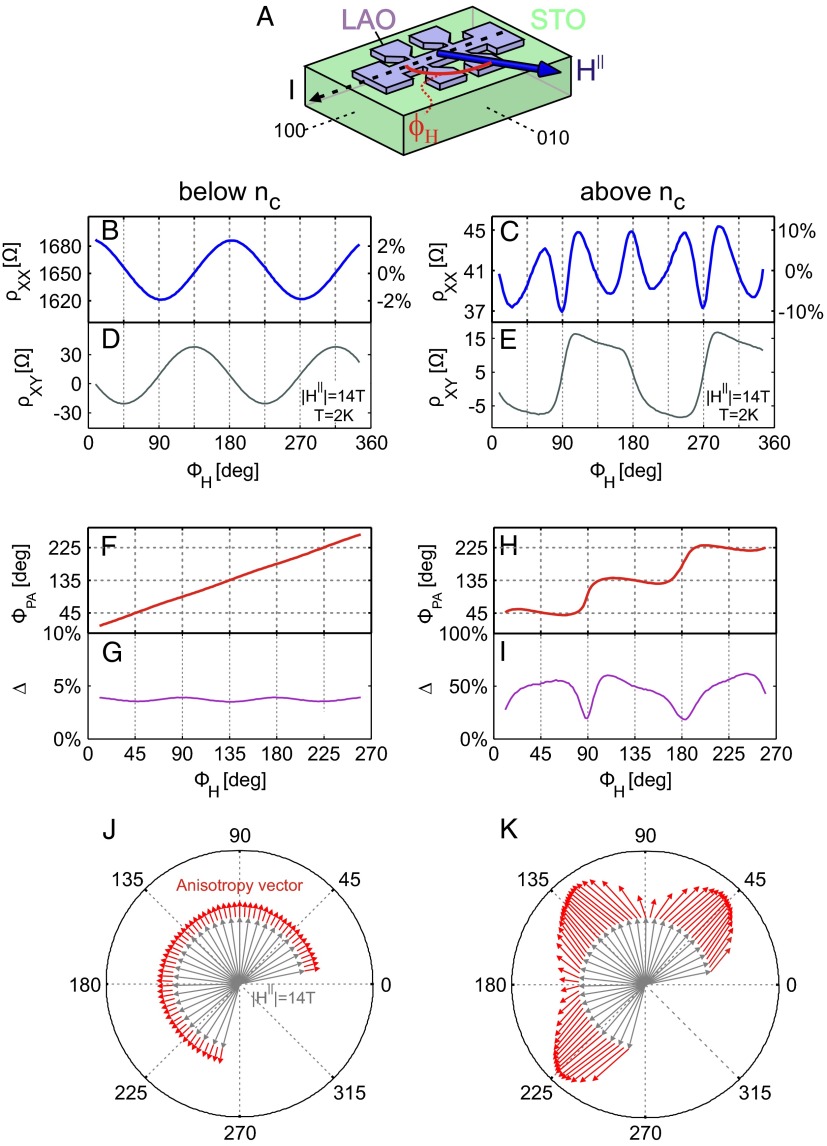
Fig. 1.
AMR measurements below and above the Lifshitz critical density,  . (A) Hall bar along the (100) crystallographic direction in LAO/STO used for measuring the transport with in-plane magnetic field
  , oriented at various angles
  , with respect to the current direction. (B and D) Measured longitudinal resistivity
  and transverse resistivity
  for
for  as a function of
  , at a gate voltage of
  , corresponding to a total carrier density
  , just below the Lifshitz transition density in this sample (22),
  . (C and E) Similar measurements for
  , corresponding to a total density
  , which is above
  . The relative change in
  is indicated on the right y axes. (F and G) Direction of the principal axes of the anisotropy with respect to the current
  and its magnitude
  , extracted by diagonalizing the resistivity tensor from the data below
  shown in B and D (text). (H and I) Similar results for the data above
 , shown in C and in E. A small offset of
  was removed from
  and
and to make them symmetric around zero. Similar analysis without the offset removed also gives pinning of the anisotropy along diagonal directions (as in H) but further breaks the symmetry between the
  and
and  directions. (J) Anisotropy vector (red arrows) below
  determined by
  and
and  , for various in-plane angles
  of
of  (gray arrows). Note that for clarity the magnitude of the anisotropy vector has been scaled up by a factor of 4 compared with K showing the corresponding results above
  .
.

