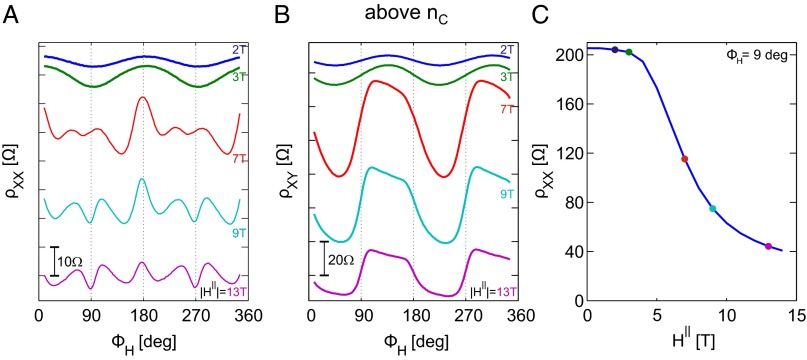
Fig. 2.
Observation of a critical field in the AMR. (A) Longitudinal resistivity  measured as a function of the angle of the field in the plane
  at various field strengths (indicated). The curves were shifted along the y axis for clarity (resistance scale is indicated on the bottom left). (B) Corresponding
  measurements. (C)
  as a function of the field strength for
  . Colored dots mark the fields corresponding to the traces in A and B.

