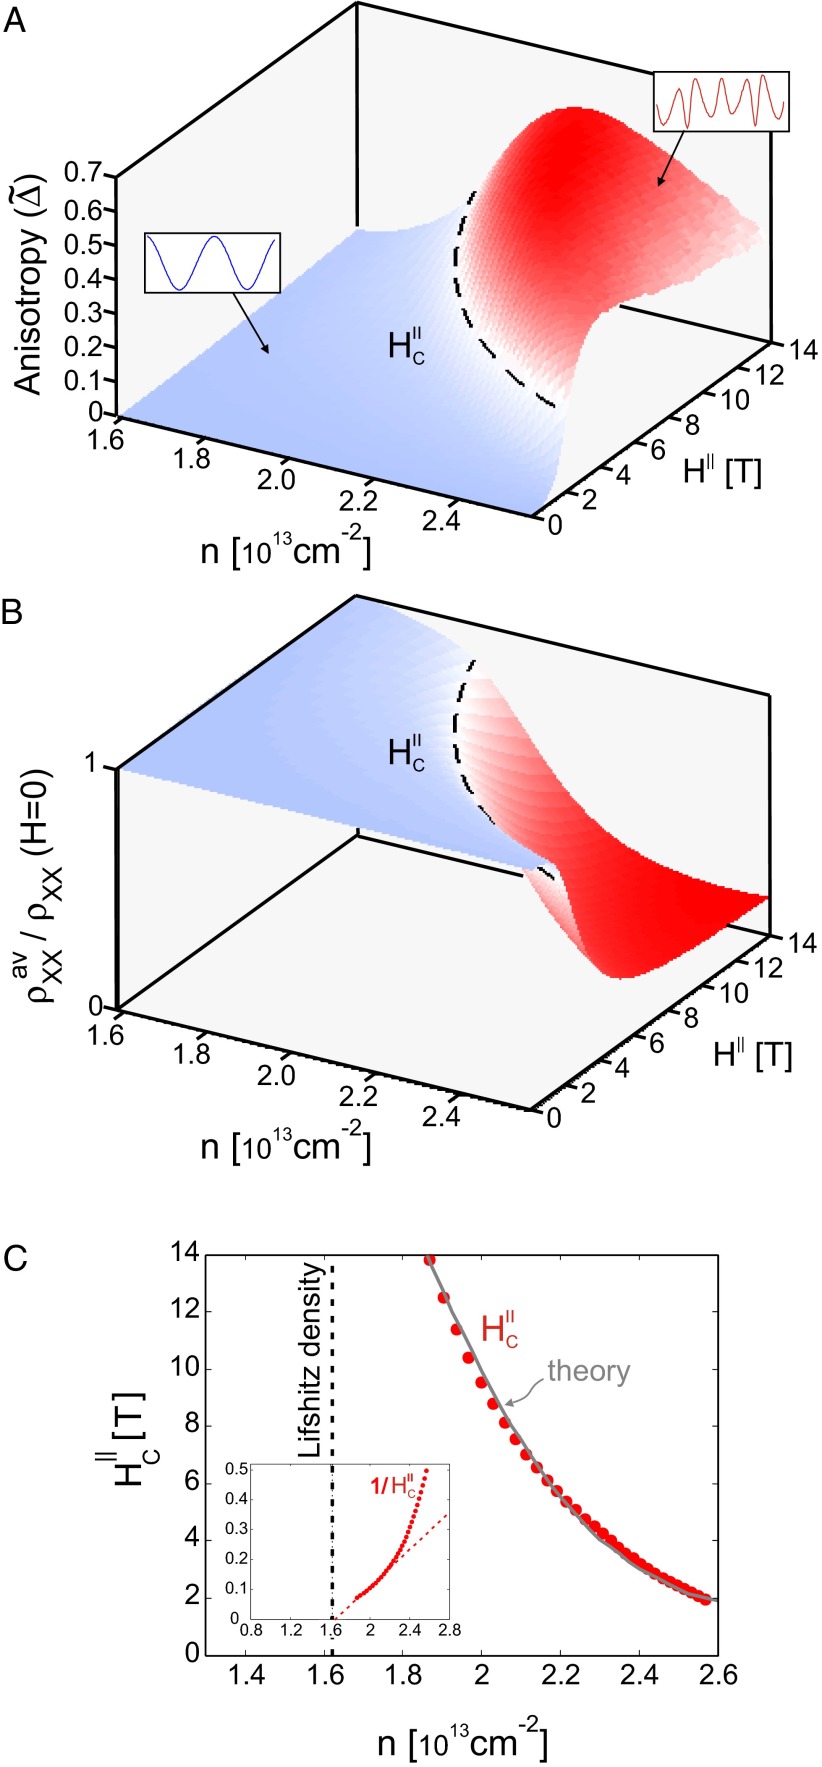
Fig. 3.
Phase diagram in the density–field plane. (A) Magnitude of the anisotropy plotted as a function of the total carrier density and magnitude of the in-plane field. Anisotropy  was determined by measuring for each density and field the modulation of
  with
with  , extracting its peak-to-peak amplitude,
  , and normalizing it by the average of
  over the angle
  ,
,  . A density-dependent critical field
  (dashed line) separates two regions of substantially different anisotropy magnitude and angular dependencies (Insets). (B) The
  -averaged
  normalized to its value at
  , plotted in the same density–field plane. The indicated
  (dashed line) is taken from A. (C) Field
  extracted from A or B plotted vs. density (solid red circles). The gray line is a fit to
  based on the theoretical model (SI Text, section 2). The vertical dashed line is the Lifshitz critical density of the sample determined from perpendicular field measurements (22). (Inset) Density dependence of
  .
.

