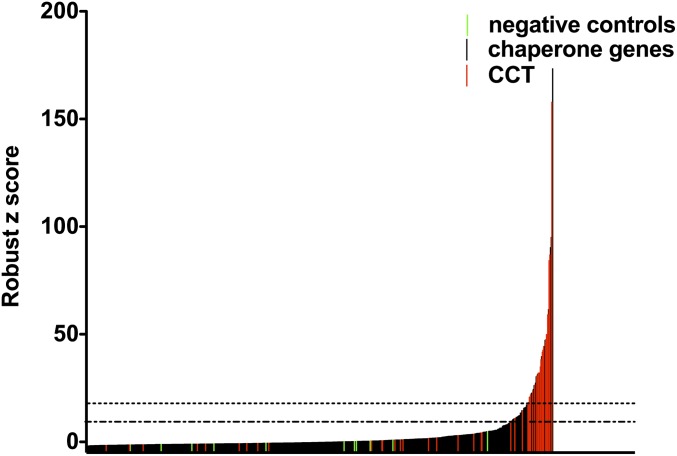
Fig. 1.
RNAi screen: primary screening data from the mouse chaperone library. Chaperone genes were knocked down by shRNA, and cells were challenged with LT. The graph shows the mean robust z score for each shRNA tested. shRNAs designed to target nonendogenous genes, such as GFP, are highlighted in green, and shRNAs targeting CCT subunits are highlighted in red. The dotted lines indicate values 1 and 2 SD from the mean.

