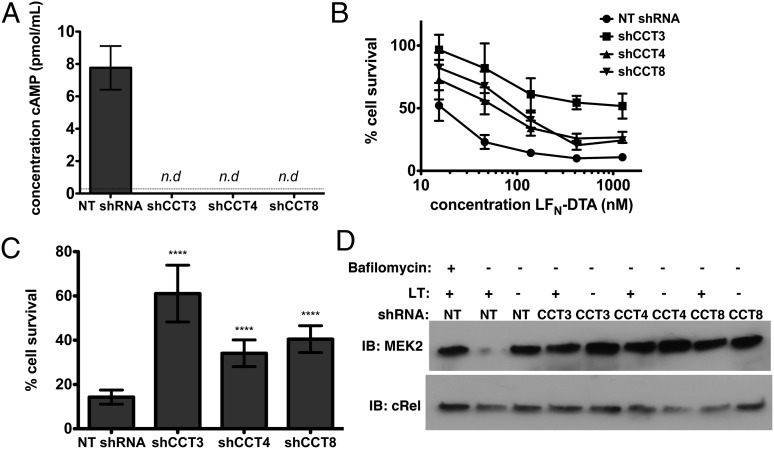
Fig. 3.
CCT is involved in a step upstream of toxin cytosolic activity. CCT knockdown in J774A.1 cells was allowed to proceed for 7 d. (A) cAMP concentration after treatment with PA and EF. The dotted line indicates the limit of detection; cAMP was not detected in shCCT cells. n.d, not detected. Data are expressed as mean ± SD of two technical replicates. (B and C) Cell survival after challenge with PA (18 nM) and LFN-DTA. The column graph in C shows cell survival at 139 pM LFN-DTA. Data are expressed as mean ± SD of eight technical replicates. ****P < 0.0001. (D) Western blot to demonstrate MEK cleavage after cells were challenged with LF and PA. cRel was used as a loading control.

