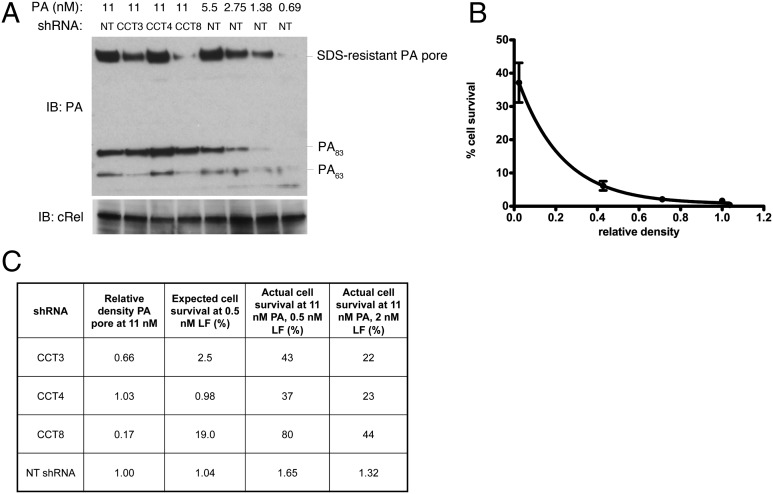
Fig. 4.
Lethal levels of anthrax toxin reach endosomes in CCT-knockdown cells. Knockdown of CCT in J774A.1 cells was allowed to proceed for 5 d. (A) Western blot to demonstrate PA pore formation after incubation with PA for 30 min. cRel was used as a loading control. (B) Standard curve showing extent of PA pore formation in nontargeting shRNA-expressing cells treated with various concentrations of PA as deduced by Western blot quantification and the corresponding amount of cell survival in cells treated with the same concentrations of PA and 0.5 nM LF for 6 h at 37 °C. (C) Table showing the expected amount of cell survival at 0.5 nM LF as predicted by the standard curve in B, and the actual amount of cell survival observed when cells were treated with 11 nM PA and the indicated concentration of LF.

