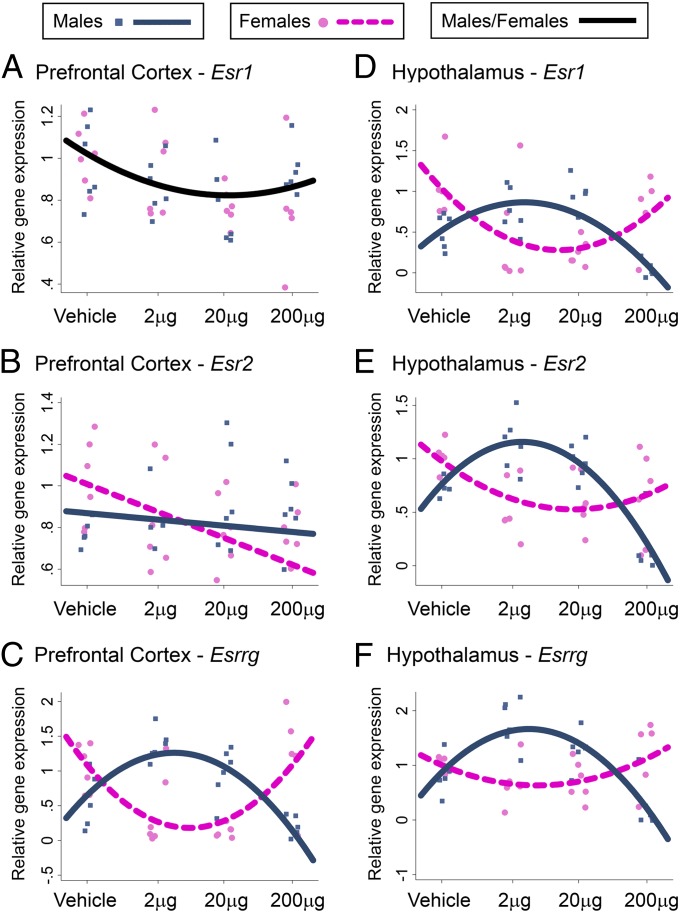
Fig. 2.
Prenatal BPA treatment effects on ER-related gene expression. Esr1, Esr2, and Esrrg gene expression was analyzed in the prefrontal cortex (A–C) and hypothalamus (D–F). Graphs include individual data points and the best-fit (linear or curvilinear) model for these data [single black line, significant non–sex-specific effect of BPA; blue (male) and pink (female) lines, significant sex-specific effect of BPA] generated by multilevel regression analyses (Stata version 12.1).

