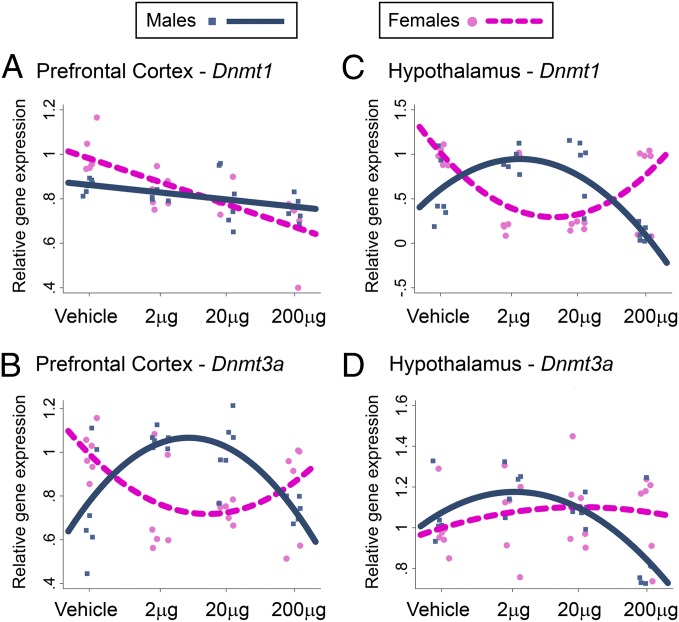
Fig. 3.
BPA treatment effects on DNMT expression. Dnmt1 and Dnmt3a gene expression was analyzed in prefrontal cortex (A and B) and hypothalamus (C and D). Individual data points and best-fit (linear or curvilinear) model for data are represented [blue (male) and pink (female) lines, significant sex-specific BPA effect].

