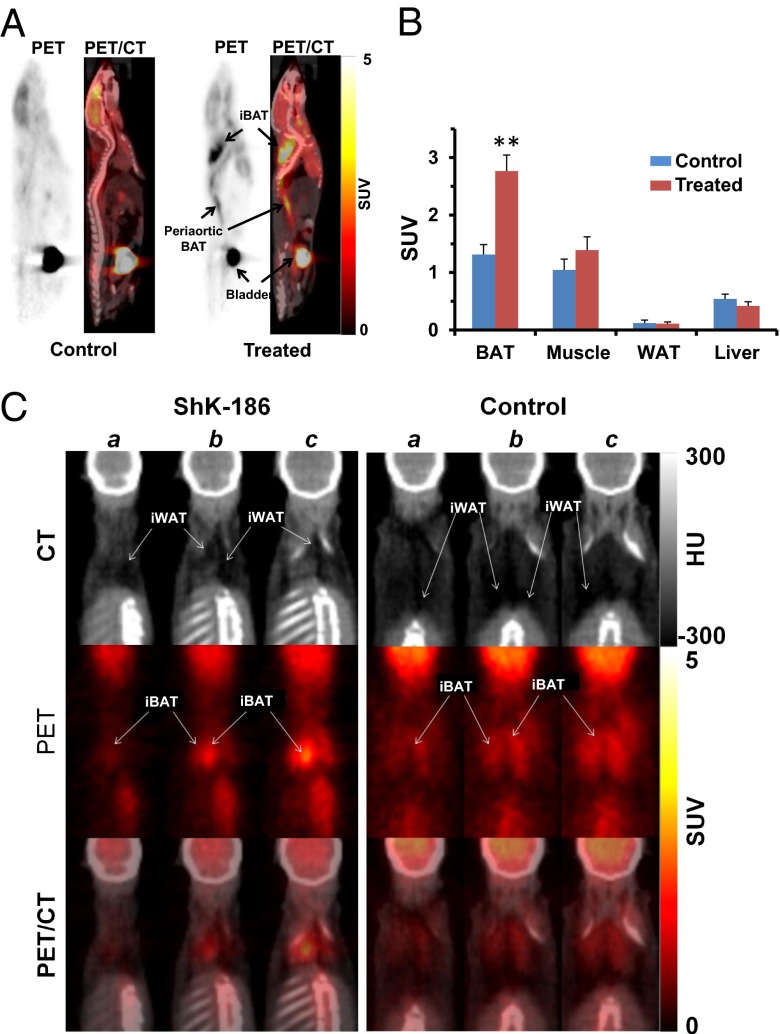
Fig. 4.
ShK-186 doubles 18F-FDG uptake into BAT without changing uptake into WAT, skeletal muscle, or liver. (A) PET and PET/CT images of 18F-FDG standardized uptake value (SUV) in control (Left) or treated (Right) mice. (B) Quantification of 18F-FDG uptake in BAT, visceral WAT, skeletal muscle, and liver. BAT uptake is twofold higher in treated mice vs. controls (Student t test; **P = 0.002). (C) Consecutive (a–c) CT images (Top) in Hounsfield units (HU) show darkened areas of WAT in interscapular adipose tissue. PET images (Middle; SUV) shows that of 18F-FDG uptake is entirely into interscapular BAT (iBAT). The overlay of PET and CT images (Bottom) show that 18F-FDG uptake is entirely into iBAT, with no uptake detected in interscapular WAT (iWAT); n = 6 in each group. All bar graphs depict mean ± SEM.

