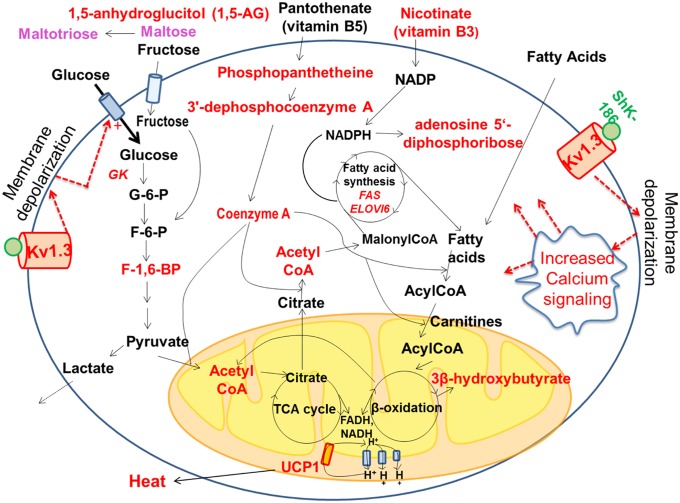
Fig. 7.
Graphical representation of metabolic pathways altered in BAT following ShK-186 treatment. Metabolites and genes with significantly enhanced expression (P < 0.05) are highlighted in red. The raw data are shown in Figs. 5 and 6, and Fig. S3. Dotted lines represent possible changes that may occur with Kv1.3 channel blockade.

