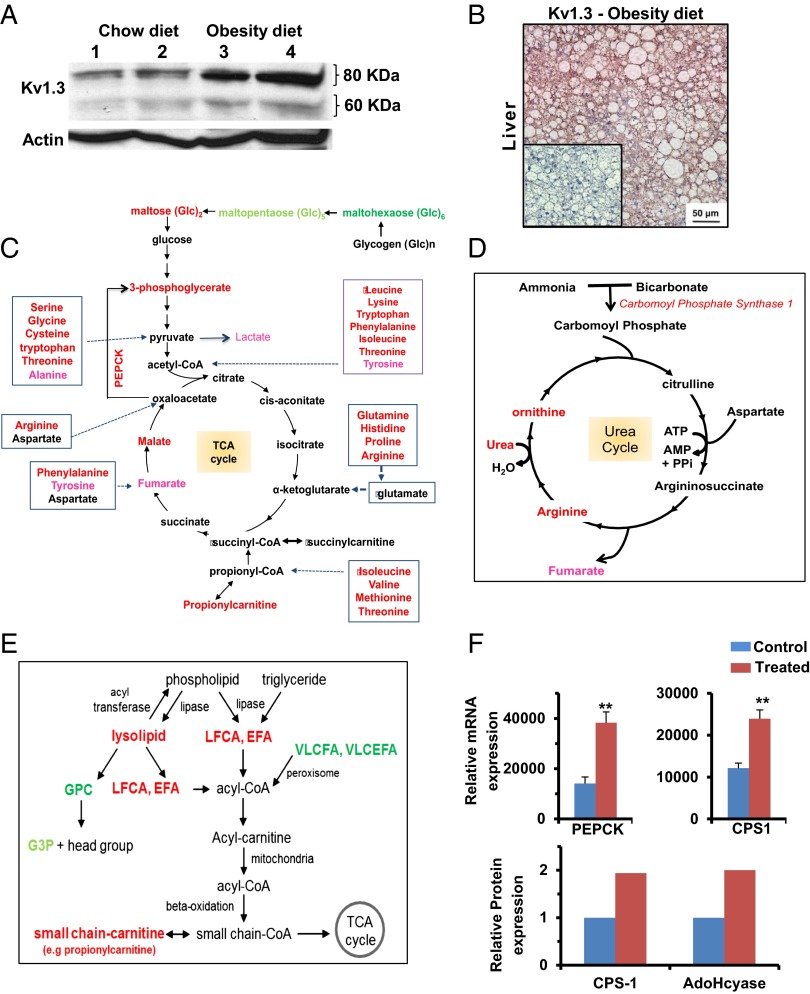
Fig. 9.
Kv1.3 expression is induced in the liver of mice on the obesity diet, and ShK-186 therapy alters energy and lipid metabolism in the liver. (A) Western blot showing Kv1.3 in the liver of mice on chow (lanes 1 and 2) vs. obesity diet (lanes 3 and 4). Actin served as the control. Livers were analyzed at week 10 of the study. Quantitation was performed by densitometry and is shown in Table S9. (B) Kv1.3 immunostaining in hepatocytes in liver from a mouse on the obesity diet. (Inset) Isotype control (polyclonal rabbit IgG in place of primary antibody). (C) Effect of ShK-186 therapy on energy metabolism in the liver; metabolites, or genes altered in expression are highlighted in red (increased P < 0.05), pink (increased P < 0.1), bright green (decreased P < 0.05), and light green (decreased P < 0.1). (D) Effect of ShK-186 therapy on the urea cycle in the liver; same color code as in C. (E) Effect of ShK-186 therapy on lipid metabolism in the liver. EFA, essential fatty acids; G3P, glycerol-3-phosphate; GPC, glycerophosphocholine; LCFA, long-chain fatty acids; VLCFA, very long-chain fatty acids; VLCEFA, very long-chain essential fatty acids; same color code as in C. (F) mRNA levels of phosphoenolpyruvate carboxykinase (PEPCK) and carbamoyl phosphate synthase 1 (CPS1), relative to 18S RNA, was determined by qPCR in livers of control and ShK-186–treated mice (Upper). Student t test; **P < 0.01. Protein levels of CPS1 and AdoHcyase from pooled samples was determined by 2-DIGE-MS (Lower; SI Materials and Methods).

