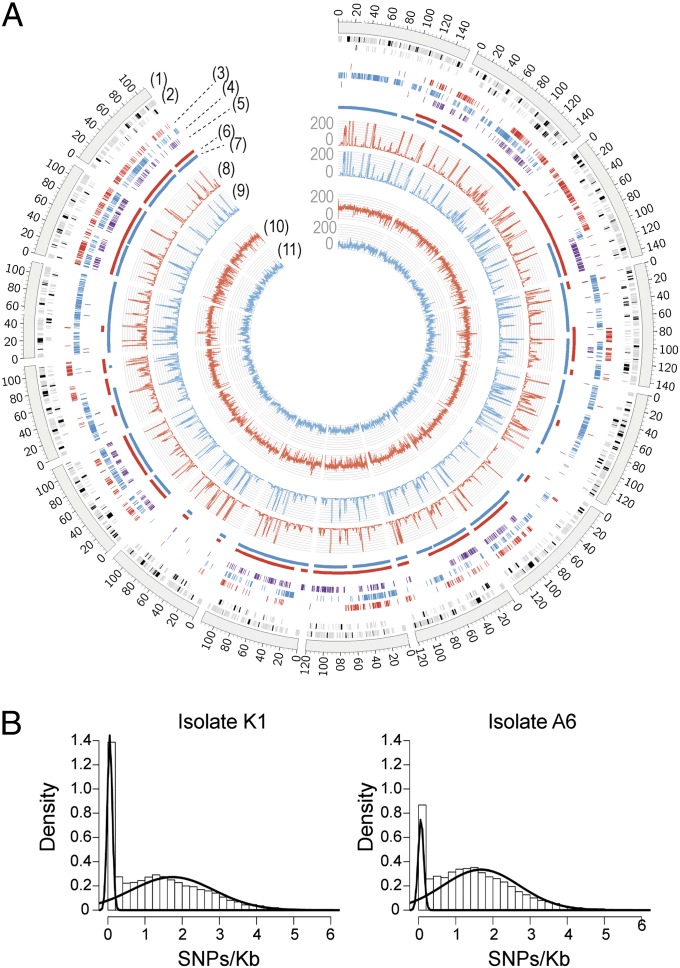
Fig. 1.
SNP distribution in B. graminis f. sp. hordei (Bgh) isolates. (A) Circular visualization of the alignment of Bgh isolates A6 and K1 genome and transcriptome sequencing reads and SNP locations with respect to the 15 largest contigs of the Bgh isolate DH14 reference genome. Bgh K1 data are highlighted in red and Bgh A6 data in blue. The scale of the coverage plots ranges from 0 to 200 (1). The 15 largest contigs of the Bgh DH14 genome (2). Locations of annotated Bgh DH14 gene models (black bars) and repeats (gray bars). As the repeat regions and gene models can be located very close to one another, the tile track has been stacked in two layers for proper visualization (3). Bgh K1 isolate-specific genomic SNPs (4). Bgh A6 isolate-specific genomic SNPs (5). Bgh DH14 isolate-specific genomic SNPs (6). Regions with a high density of SNPs between K1 and DH14 as identified through a hidden Markov model (7). Regions with a high density of SNPs between A6 and DH14 (8). Bgh K1 RNA-Seq read coverage (average per 100 bases) (9). Bgh A6 RNA-Seq read coverage (average per 100 bases) (10). Bgh K1 genome read coverage (average per 100 bases) (11). Bgh A6 genome read coverage (average per 100 bases). (B) Histograms of SNP density distributions in Bgh isolates A6 (Right) and K1 (Left) based on a sliding window of 10 kb. The curves are based on a two-component mixture model fitted to the distributions using the expectation-maximization algorithm.

