Fig. 5.
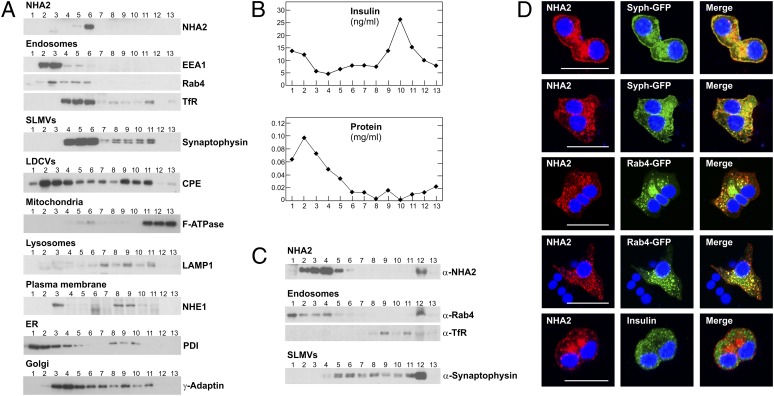
NHA2 localizes to endosomes and SLMVs. (A) Subcellular fractionation of Min6 cells on a linear sucrose gradient. Thirteen fractions (from top to bottom) were collected after sucrose gradient centrifugation, and equal volumes of each fraction were analyzed by immunoblotting with antibodies directed against NHA2, EEA1, Rab4, transferrin receptor (TfR; endosomal markers), synaptophysin (SLMV marker), carboxypeptidase E (CPE; LDCV marker), F-ATPase α-subunit (mitochondrial marker), LAMP1 (lysosomal marker), NHE1 (plasma membrane marker), protein disulfide–isomerase (PDI; endoplasmic reticulum marker), and γ-adaptin (trans-Golgi network marker). (B) Protein and insulin concentration (as additional marker for LDCVs) of individual fractions. (C) Glycerol velocity gradient fractionation to separate endosomes and SLMVs. Fraction 1 corresponds to the top of the gradient. Equal volumes of each fraction were analyzed by immunoblotting with indicated antibodies. (D) Confocal images of Min6 cells transfected with HA-tagged NHA2 and GFP-tagged synaptophysin or GFP-tagged Rab4 or counterstained with anti-insulin antibody. Colocalization is indicated by yellow in merged images. (Scale bars: 20 μm.)

