Fig. 6.
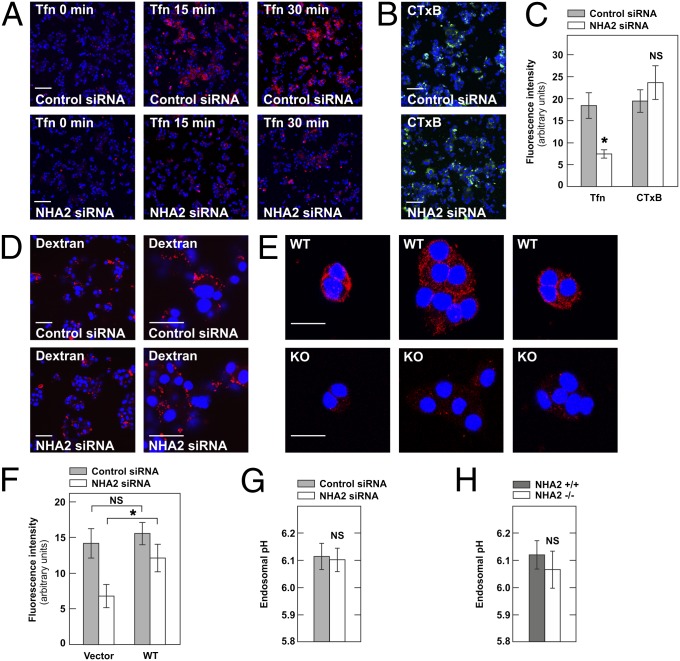
NHA2 is required for clathrin-dependent endocytosis in Min6 and β-cells. (A) Transferrin–Alexa Fluor 568 (Tfn; red) uptake in Min6 cells treated with control (Upper) or NHA2-targeting siRNA (Lower) for indicated time. (Scale bars: 100 μm.) (B) Cholera toxin B–Alexa Fluor 488 (CTxB; green) uptake for 30 min in Min6 cells treated with control or NHA2-targeting siRNA. (Scale bars: 100 μm.) (C) Quantification of transferrin–Alexa Fluor 568 and cholera toxin B–Alexa Fluor 488 uptake for 30 min in Min6 cells treated with control or NHA2-targeting siRNA. Data are means ± SD of three experiments. *P < 0.05; NS, not significant. (D) Fluid-phase uptake assay performed in Min6 cells treated with control or NHA2-targeting siRNA by incubation for 30 min with lysine-fixable Texas Red–Dextran before fixation. Images are representative of three experiments. [Scale bars: 100 μm (Left) or 30 μm (Right).] (E) Transferrin–Alexa Fluor 568 (red) uptake for 30 min in primary β-cells isolated from NHA2 WT (WT) and KO (KO) mice. (Scale bars: 20 μm.) β-cells were identified by costaining with anti-insulin antibody (Fig. S10). Images are representative of three experiments. (F) Quantification of transferrin–Alexa Fluor 568 uptake for 30 min in Min6 cells treated with control or NHA2-targeting siRNA and transfected with control plasmid (vector) or WT NHA2 (WT). Data are means ± SD of three experiments. *P < 0.05; NS, not significant. (G) pH of transferrin-positive perinuclear endosomes in Min6 cells treated with control or NHA2-targeting siRNA (n = 6 per condition, pooled from two experiments). Data are means ± SEM. NS, not significant. (H) pH of transferrin-positive perinuclear endosomes in WT and NHA2 KO β-cells (n = 21 per condition, pooled from three experiments). Data are means ± SEM. NS, not significant.

