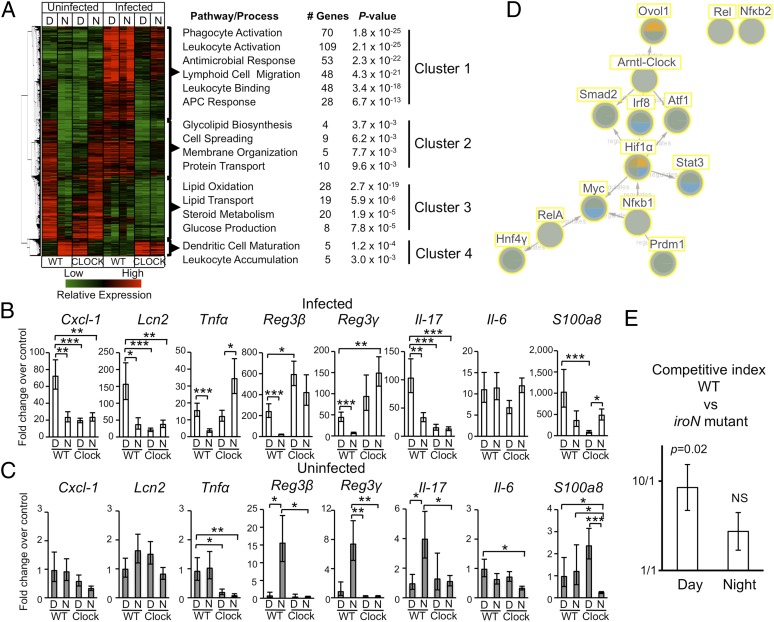
Fig. 4.
Microarray analysis from cecum of mice infected with S. Typhimurium reveals a circadian mechanism modulating the response to acute bacterial infection. (A) Heat diagram showing changes in gene expression detected in the ceca of mice 72 h p.i. with S. Typhimurium at day (D, ZT4) or night (N, ZT16) in WT and Clock mutant mice, compared with uninfected controls (n ≥ 3). Representative results from two animals are shown. Relative increase (red) or decrease (green) of mRNA level is shown. A list of the most represented subcategories of genes from each cluster, the number of genes included in each subcategory, and the relative P value are shown. (B and C) Transcriptional profiles of selected proinflammatory/antimicrobial genes identified in cluster 1. Significant changes are shown. *P < 0.05; **P < 0.01; ***P < 0.001. (D) Network of transcription factors involved in regulation of subsets of genes included in cluster 1. Significant changes (P < 0.05) are shown as colored circles (blue, WT infected vs. uninfected day; green, WT infected vs. uninfected night; brown, Clock mutant infected vs. uninfected day; orange, Clock mutant infected vs. uninfected night). (E) Competitive infection with a mixture of S. Typhimurium WT and iroN mutant at two different times of the day (day, ZT4; night, ZT16). Bars indicate the average competitive index of bacteria recovered from colon contents. Data represent geometric means ± SEM (n = 10 each group).

