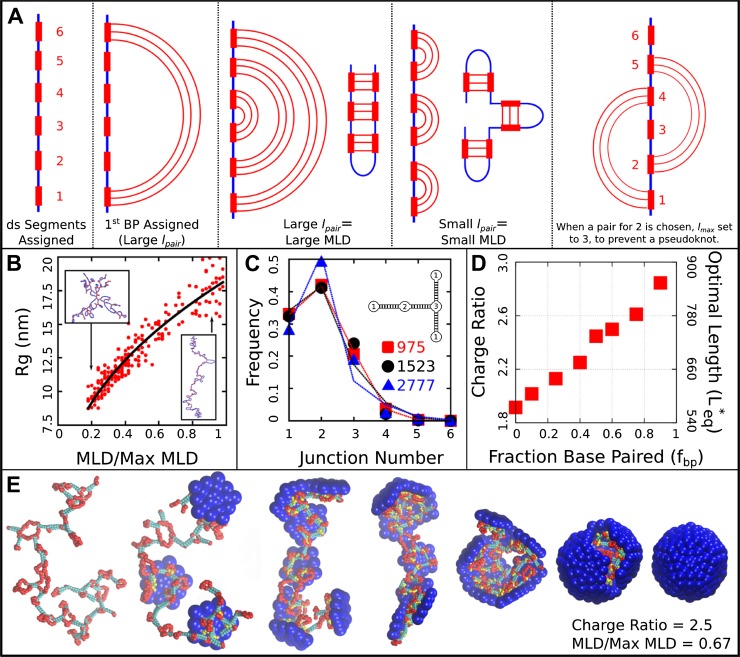
Figure 6.
Base-paired polymer setup and analysis. (A) Schematic illustrations of the algorithm we used to obtain a wide range of base-paired structures. From left to right, double-stranded (ds) segments are first randomly assigned. These segments are then base-paired together, starting from one end. If base-paired segments are widely separated (i.e., is large) then subsequent nested base-pairs lead to an extended structure. Conversely, if is small, less extended structures form. The right-most panel indicates a psuedoknot, a structural motif we have prevented from occurring in this model, by setting to the last unpaired segment. (B) Radius of gyration for model NAs isolated in solution as a function of maximum ladder distance (MLD) normalized by the maximum possible MLD. The nucleic acid has 1000 nt, 50% of which are base-paired. (C) The frequency of junction numbers can be altered by varying λ in Equation 2, with large values of λ leading to large values of . The symbols indicate the relative frequency of junction numbers for biological RNAs with indicated lengths, obtained from Ref. (Gopal et al., 2012), and the lines are best fits to these distributions generated by varying λ. The inset illustrates several different junction orders. (D) The thermodynamic optimum length measured for the simple model capsid as a function of the fraction of base-paired nucleotides for a simplified ‘hairpins only’ model (red squares). (E) Snapshots illustrating assembly around a NA. Beads are colored as follows: blue = excluders, yellow = ARM bead, red = single-stranded NA, cyan = double-stranded NA. ‘Top’, ‘Bottom’, and ‘Attractor’ beads removed for clarity.

