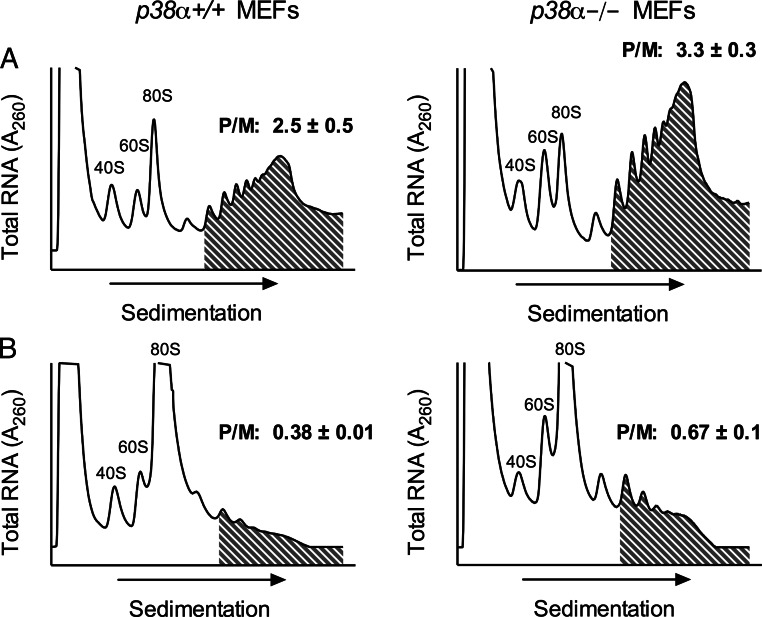
Fig. 6.
PRP of p38α+/+ and p38α-/- mouse[b] embryonic fibroblasts. A, p38α+/+ MEFs (left panel) and p38α-/- MEFs (right panel) were exposed to cytomix for 4 h and then subjected to PRP as detailed in Materials and Methods. B, p38α+/+ MEFs (left panel) and p38α-/- MEFs (right panel) were exposed to cytomix plus 1 μm Tg for 4 h, and then subjected to PRP. Panels indicate the positions of RNAs occupied by 40S, 60S, 80S ribosomal subunits, and the shaded region indicates the polyribosome region. P/M indicates the polyribosome/monoribosome RNA ratio, as determined by area under the curve (AUC) analysis. The P/M values are statistically different in panel B by Student's t test.

