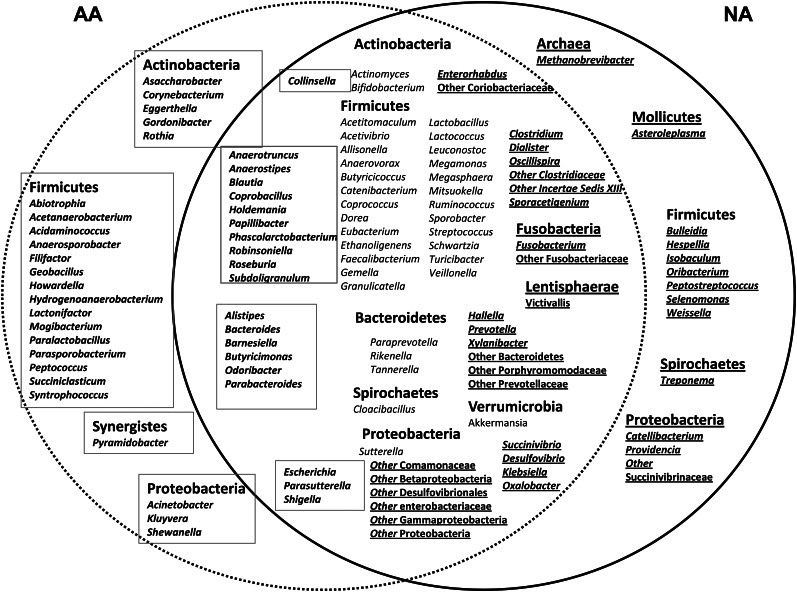
FIGURE 3.
Illustration of the similarities and differences in fecal microbial taxa between AAs and NAs. The solid circle encloses the taxa that were detected in NA and the dotted circle those identified in AA. The overlap between the 2 circles contains taxa common to both populations. Much of the shared taxa were significantly (independent Kruskal-Wallis tests) more enriched in one group than in the other, indicated by the boxed text in AAs on the left and underlined text in NAs on the right. AA, African American; NA, native African.

