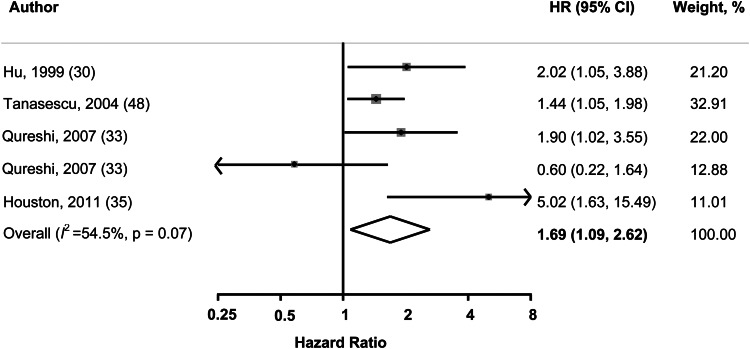
FIGURE 3.
Pooled HRs and 95% CIs of incident overall CVD in diabetic patients. The pooled estimates were obtained by using a random-effects model. The dots indicate the adjusted HRs from a comparison of the highest category of egg consumption (≥1 egg/d) with the lowest (<1 egg/wk or never). The size of the shaded square is proportional to the weight of the individual study. The horizontal lines represent 95% CIs. The diamond data markers indicate the pooled HR.

