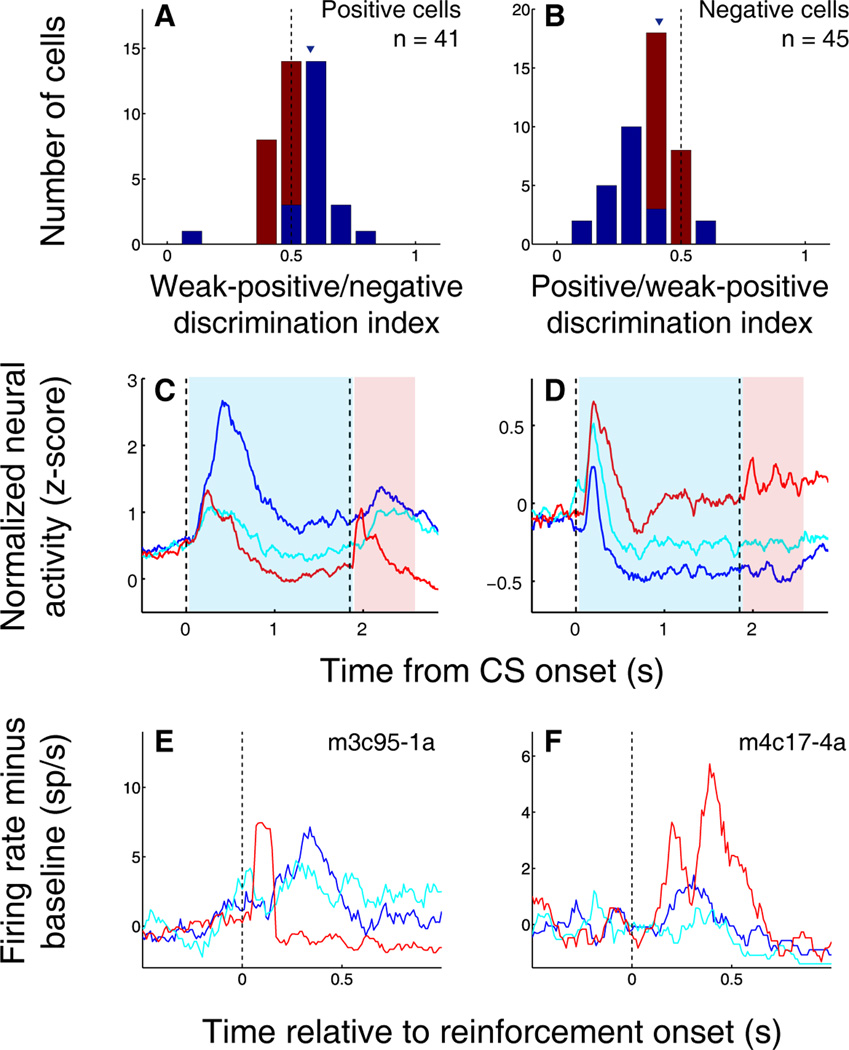
Figure 2.
OFC neuronal responses integrate information about appetitive and aversive stimuli. (A) Weak-positive/negative discrimination indices for all positive value-coding neurons. (B) Positive/weak-positive discrimination indices for all negative value-coding neurons. In (A) and (B), blue indicates significant discrimination index (p < 0.05, permutation test) and red indicates non-significant discrimination index. (C,D) Population average PSTH for all positive (C) and negative (D) value-coding neurons. Blue line, positive trials; cyan line, weak positive trials; red line, negative trials. Vertical dashed lines indicates image onset and reinforcement onset. Blue shading, CS-trace interval, activity different among all three trial types (p ≤ 0.001 for all comparisons, Wilcoxon); red shading, reinforcement interval, activity different among all three trial types (p ≤ 0.01 for all comparisons, Wilcoxon). (E–F) PSTHs of neural activity aligned on reward or air-puff onset. Activity is normalized by subtracting the average activity from the 500 ms preceding reinforcement. Vertical dashed line, reinforcement onset. Blue, response to large reward; cyan, response to small reward; red, response to air-puff. (A,B) Positive value-coding cell with excitatory responses to reward and air-puff. (C,D) Negative value-coding cell with excitatory responses to large reward and air-puff.

