
Figure 3.
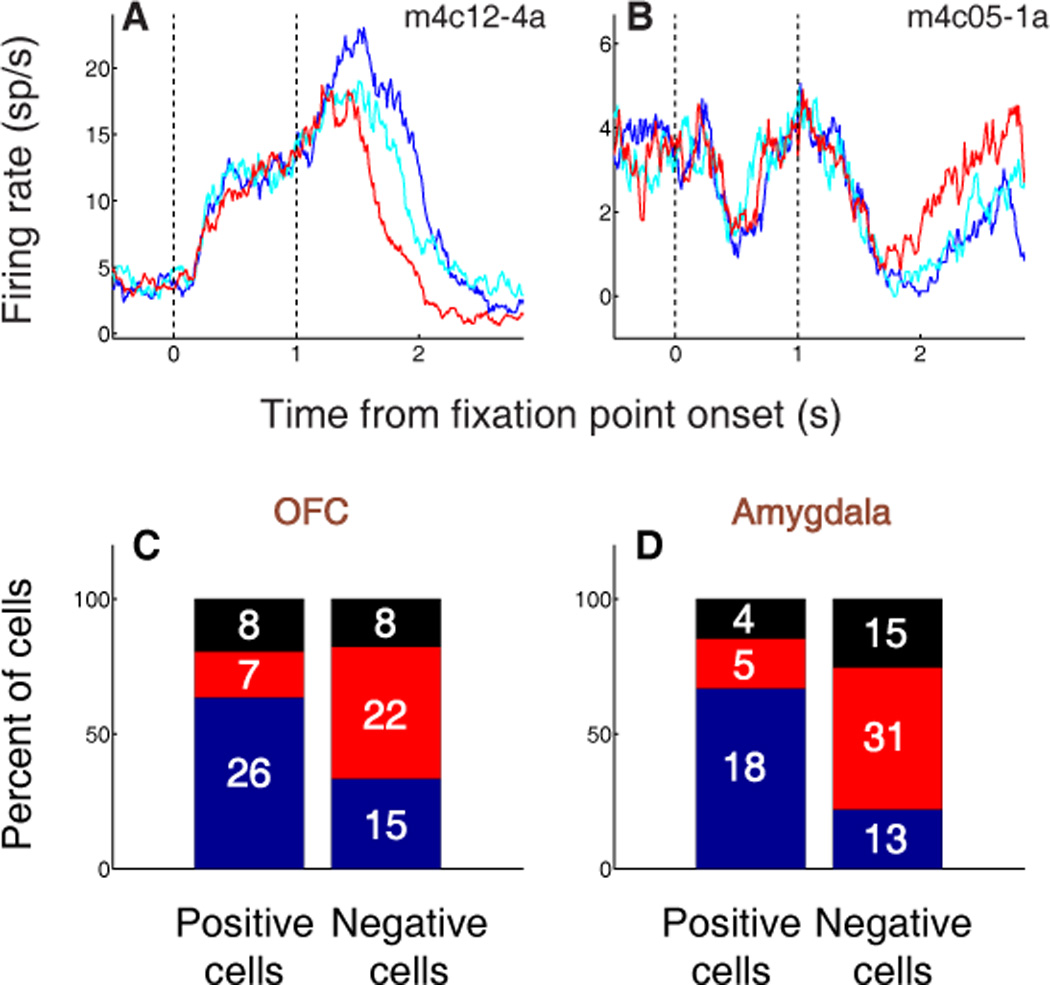
OFC and amygdala neurons encode the value of states initiated by fixation point presentation. (A,B) PSTHs aligned on fixation point (FP) presentation for two individual OFC neurons. Blue, FP response on positive trials; cyan, FP response on weak positive trials; red, FP response on negative trials. (A) Positive value-coding cell exhibiting an increase in firing rate during FP presentation. (B) Negative value-coding cell exhibiting a decrease in firing rate during FP presentation. (C,D) Percentage of value-coding cells in OFC (C) and amygdala (D) with increases (blue), decreases (red), or no change (black) in firing rate during FP presentation. The number of cells in each category is indicated. In both brain areas, a plurality of positive value-coding cells increase firing in response to the FP, while a plurality of negative value-coding cells decrease firing in response to the FP.