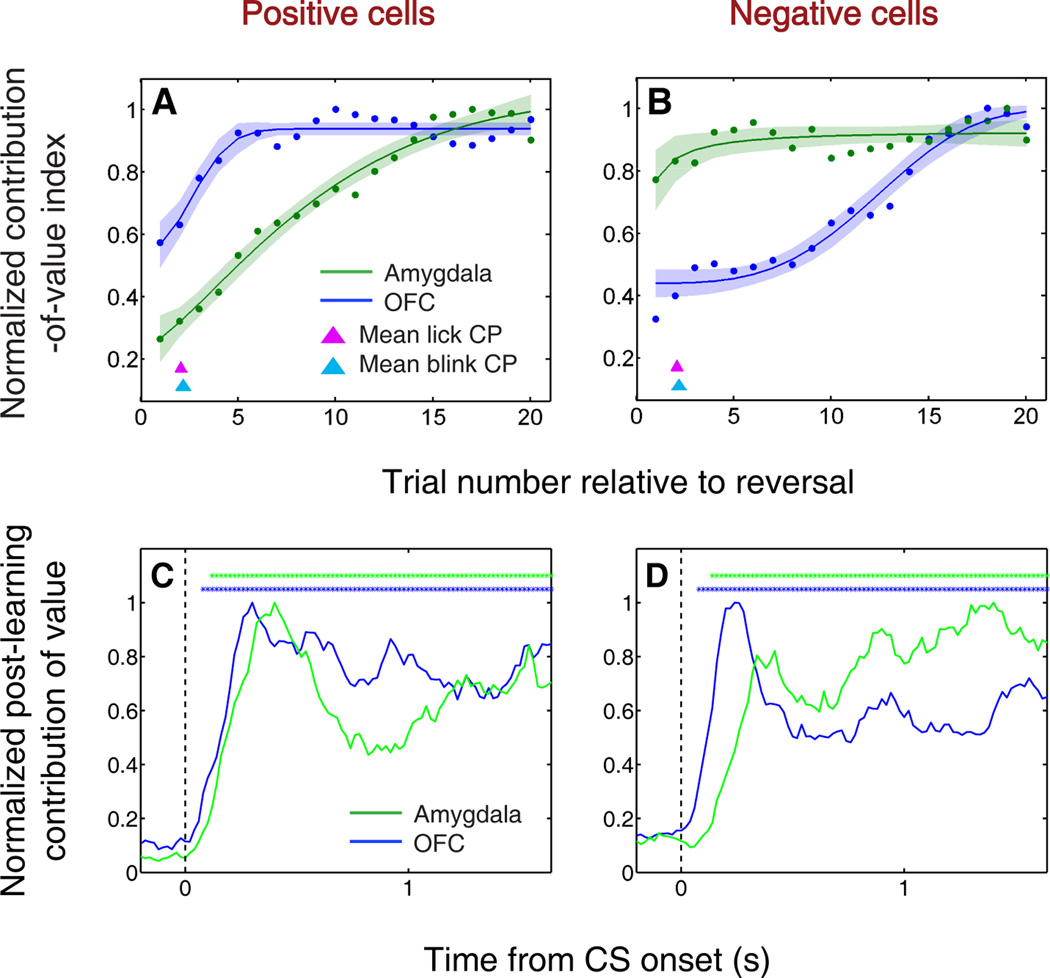
Figure 4.
Positive and negative value-coding neurons exhibit different time courses of learning-related activity, but encode value earlier in OFC than amygdala after learning. (A,B) Normalized average contribution of image value to neural activity plotted as a function of trial number after reversal for positive value-coding neurons (A) and negative value-coding neurons (B). Contribution-of-value index is derived from a two-way ANOVA with factors of CS value and CS identity, applied over a six-trial window and stepped by one trial at a time. Red and cyan arrowheads indicate mean licking and blinking change points, respectively; the width of each arrowhead’s base indicates SEM. Neural activity is taken from 90–590 ms after CS onset. Curves are best-fit sigmoids (± 95% prediction intervals). (C,D) Normalized average contribution of image value as a function of time for positive value-coding cells (C) and negative value-coding cells (D). Contribution of value is again derived from a two-way ANOVA, now applied to 200 ms bins and stepped by 20 ms across the trial. Asterisks, time points at which the average contribution of value is significant (Fisher p < 0.0001) for OFC (blue) or amygdala (green).

