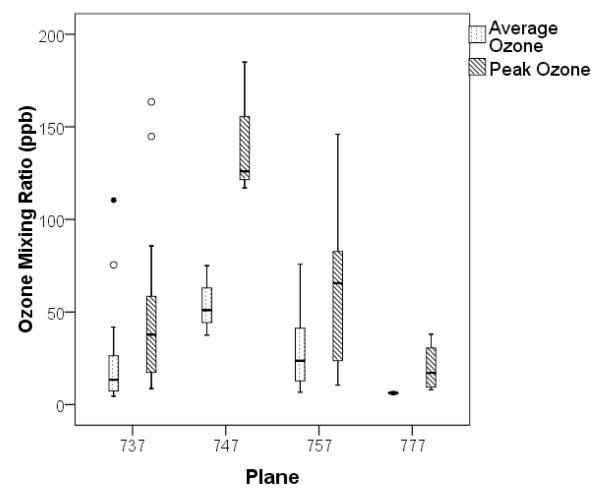
Figure 3.
Box and whisker plot of mean and peak ozone concentrations measured while at cruising altitude according to aircraft type. The airline and flight routes selected were flown by Boeing aircraft. The line in the box is the median, the box represent the 25th and 75th quartiles, the whiskers the upper and low bounds of the distribution calculated as 1.5 times the interquartile range away from the 25th and 75th quartile and the circles suspect outliers (open circle) and extreme outliers (filled in circle) based on the distribution

