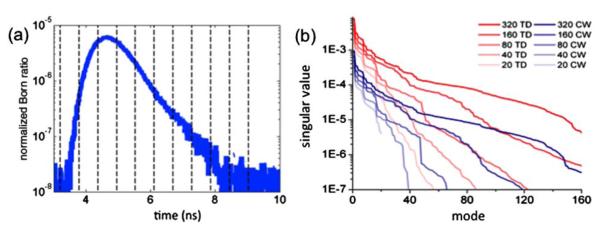
Fig. 1.

(Color online) (a) Sample experimental TPSF, to be binned into the 10 time gates shown by dotted lines bounding each time gate, (b) singular value spectra for the time domain (TD, blue) and continuous wave (CW, red) Jacobians. Shown are 320, 160, 80, 40, and 20 optical projection Jacobian spectra in order of decreasing opacity.
