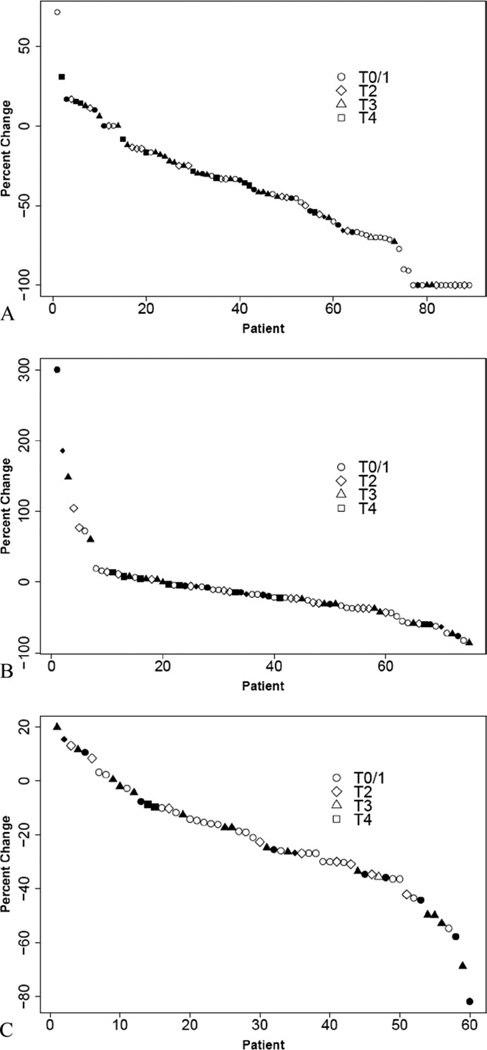
Figure 3.
Waterfall plots for (A) clinical response (Response Evaluation Criteria in Solid Tumors [RECIST]), (B) ultrasonography response RECIST, and (C) mammography RECIST response from central measurements. Response data, as percentage change from baseline are plotted as a sorted continuous feature. Solid symbols, patients who underwent mastectomy; open symbols, patients who underwent breast conservation; circles, pathologic T1/0 disease; diamond T2 disease; triangle T3; square T4.

