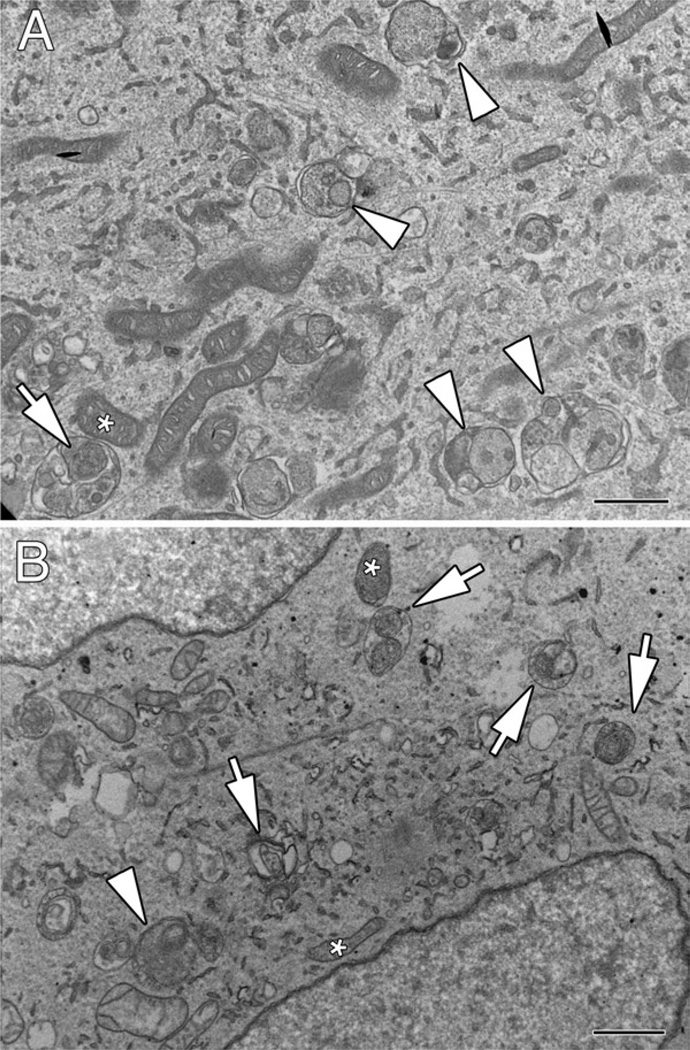
Fig. 1.
Analysis of AVi content by electron microscopy using an inhibitor of autophagosome–lysosome fusion. (a) Control SH-SY5Y cells were treated with 5 nM bafilomycin A1 × 24 h prior to fixation and analysis by electron microscopy. Note the accumulation of several AVis containing heterogeneous cytoplasmic material (arrowheads). An occasional AVi exhibits a mitochondrial profile (arrow) similar to an adjacent mitochondrion in the cytoplasm (asterisk). (b) The PINK1 shRNA line A14 was treated with 10 nM bafilomycin A1 × 2 h prior to fixation and analysis by electron microscopy. Mitochondrial profiles are readily identified in the bafilomycin-trapped AVis (arrows), although generalized cargo was also observed in some (arrowhead). Note heterogeneity in electron density of mitochondria within AVis that are similar to heterogeneity observed among free mitochondria in the cytoplasm (asterisks). In the absence of bafilomycin A1, cargo is typically altered to the extent that it can no longer be recognized (see, for example, published images of the A14 cell line in (6, 8)). Scale bars: 1 µm.

