
FIGURE 3.
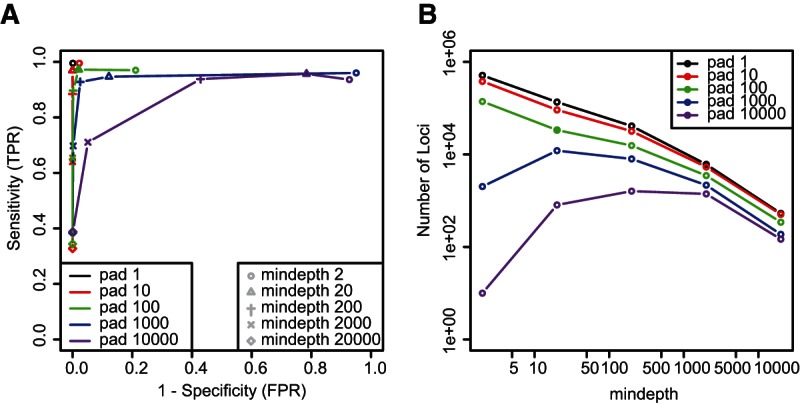
Performance analysis of small RNA clustering by ShortStack. (A) Receiver operating characteristic (ROC) curves based on ShortStack analyses of the col_leaf data set in --nohp mode, using the indicated values of options --pad and --mindepth. (TPR) True positive rate, (FPR) false positive rate. Filled triangle indicates default settings. (B) Number of small RNA loci from the col_leaf data set annotated by ShortStack with the indicated settings of --pad and --mindepth. Filled circle indicates default settings.