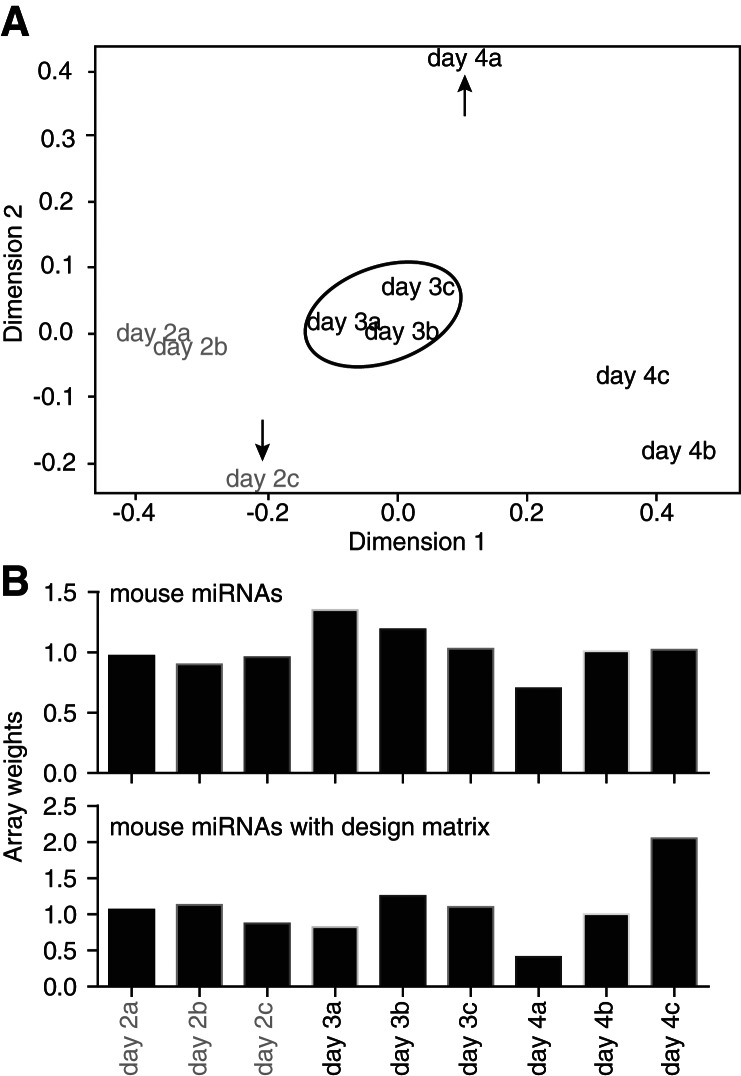
FIGURE 4.
Examination of the relationship between samples and calculation of array quality weights, restricted to the mouse miRNA probe sets. (A) Multidimensional scaling (MDS) plot of the summarized microarray data following robust normexp background correction with cyclic loess normalization. This MDS plot shows the relationship between samples. Arrays day 2c and day 4a were not well grouped with arrays from the matching biological replicates, as indicated with the arrows. (B) Array quality weights were calculated using arrayWeightsSimple in limma, with or without considering the design matrix. The array weights calculated with the design matrix reflect the relationship between the samples seen in the MDS plot (A), with sample 2c and 4a having lower weights compared to 2a/2b and 4b/4c, respectively. These weights were used in the further comparisons of the normalization methods.

