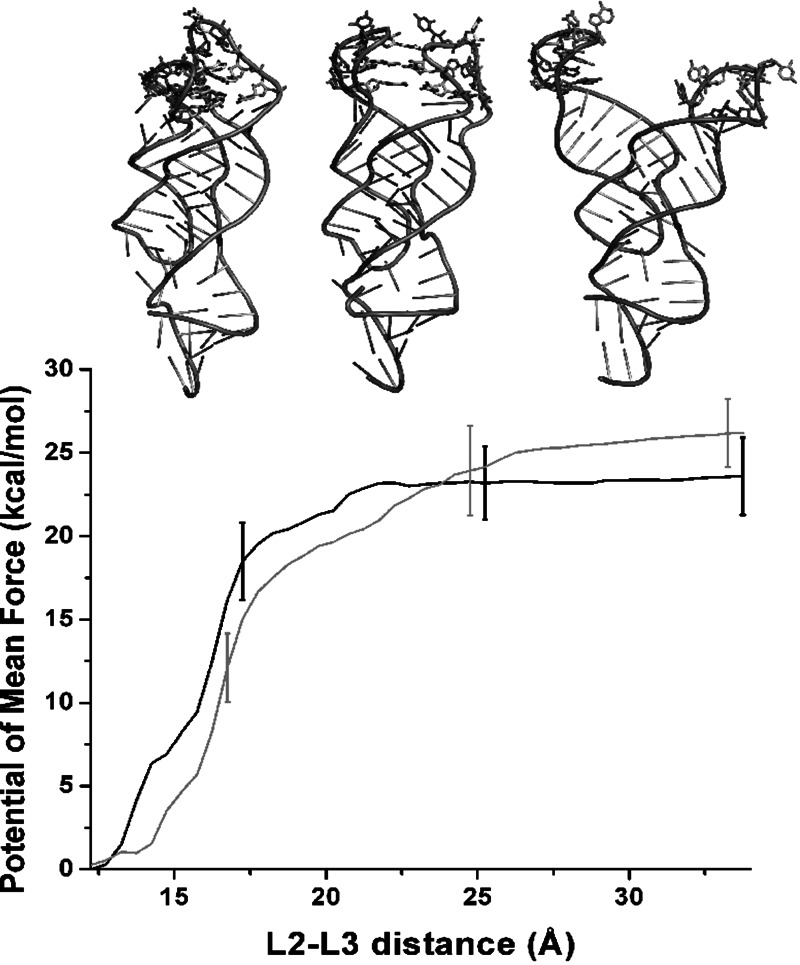
FIGURE 5.
Riboswitch aptamer in the absence of adenine. Potentials of mean force along the distance between the center of mass of L2 loop and L3 loop backbone atoms. Black and gray lines represent independent replicas. Error bars are plotted only for three points. Insets show the average aptamer structure at a L2-L3 distance of 13, 22, and 34 Å.

