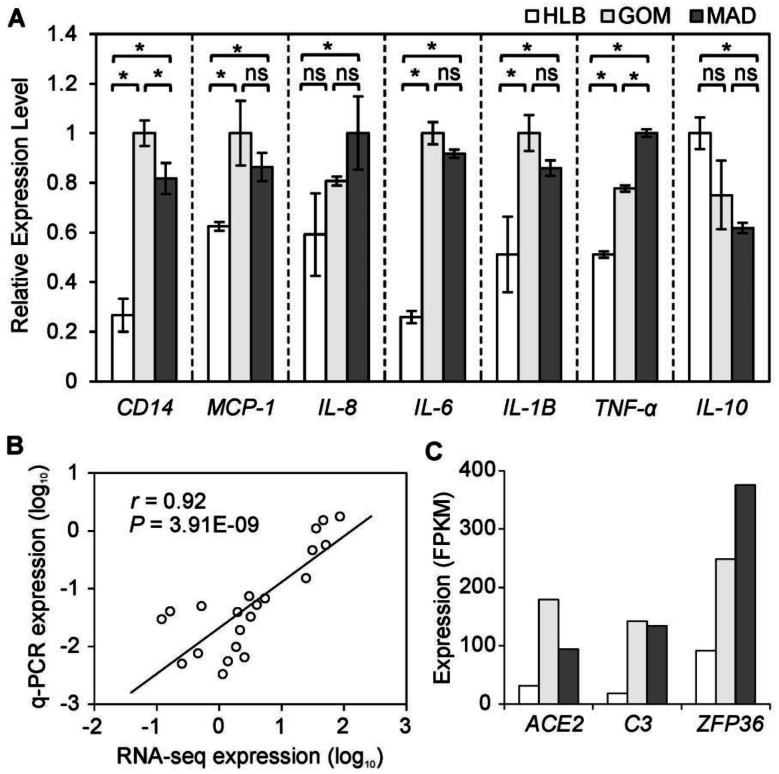
Fig 2.
Inflammatory gene expression patterns in three adipose tissues. (A) Seven inflammatory indicators were measured using q-PCR. Data are expressed as mean ± SD, and statistical significance was assessed using one-way ANOVA and the Tukey multiple range test. * indicates P < 0.05; ns: not significant. (B) Correlation between gene expressions as measured using q-PCR and RNA-seq methods. (C) Expression of DE genes involved in inflammation.

