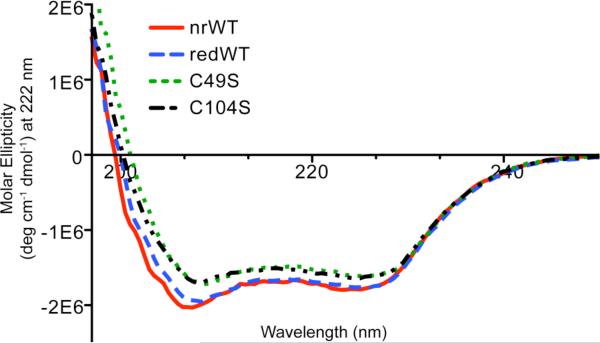
Figure 4. CD Spectra of PRL-1 Variants.
The secondary structure elements of the various mutants were analyzed by monitoring the CD signal from 190-250 nm. The data points represent the average of two replicates of two independently prepared samples. Error bars were omitted for figure quality purposes. All data points below 203 nm are statistically identical. At 208, 212 and 222 nm, where absorbance for α-helix and β-sheet are commonly observed, the values are statistically different.

