
Fig. 1.
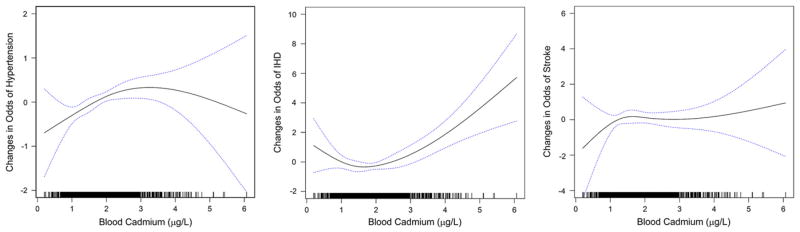
Nonlinear association between cadmium levels and the changes in odds of CVD outcomes adjusting for age, age2, gender, education level (less than high school, high school, and above college or more), income (<$9000, $9000–$16,000, $16,000–$25,000, and $25,000>), family hypertension history (yes/no), alcohol (none, moderate, and heavy), BMI, waist circumference, and blood lead. The predicted values are indicated by the solid line and their 95% confidence intervals by the blue dashed lines. Blood cadmium levels of all individual subjects are indicated by short vertical lines on the abscissa. (For interpretation of the references to color in this figure legend, the reader is referred to the web version of this article.)