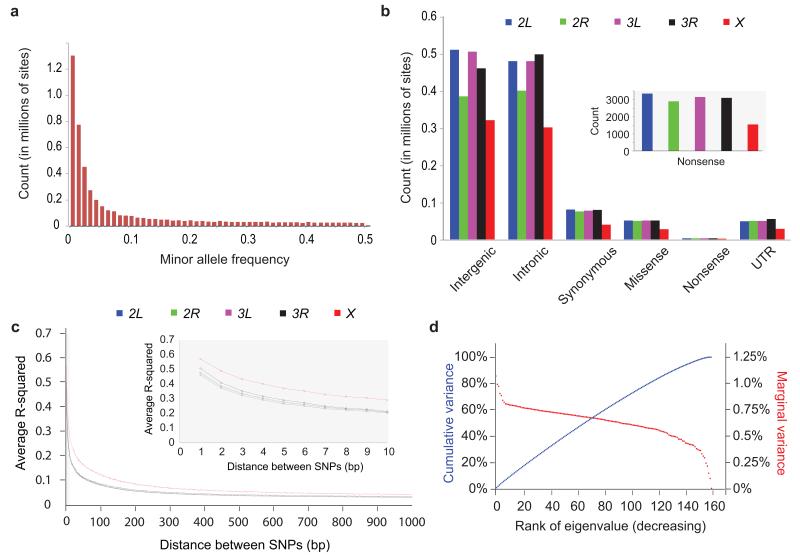
Fig. 1.
SNP variation in the DGRP lines. (a) Site frequency spectrum. (b) Numbers of SNPs per site class. (c) Decay of LD (r2) with physical distance for the five major chromosome arms. (d) Lack of population structure. The red curve depicts the ranked eigenvalues of the genetic covariance matrix in decreasing order with respect to the marginal variance explained; the blue curve shows their cumulative sum as a fraction of the total with respect to cumulative variance explained. The partitioning of total genetic variance is balanced among the eigenvectors. The principal eigenvector explains <1.1% of the total genetic variance.

