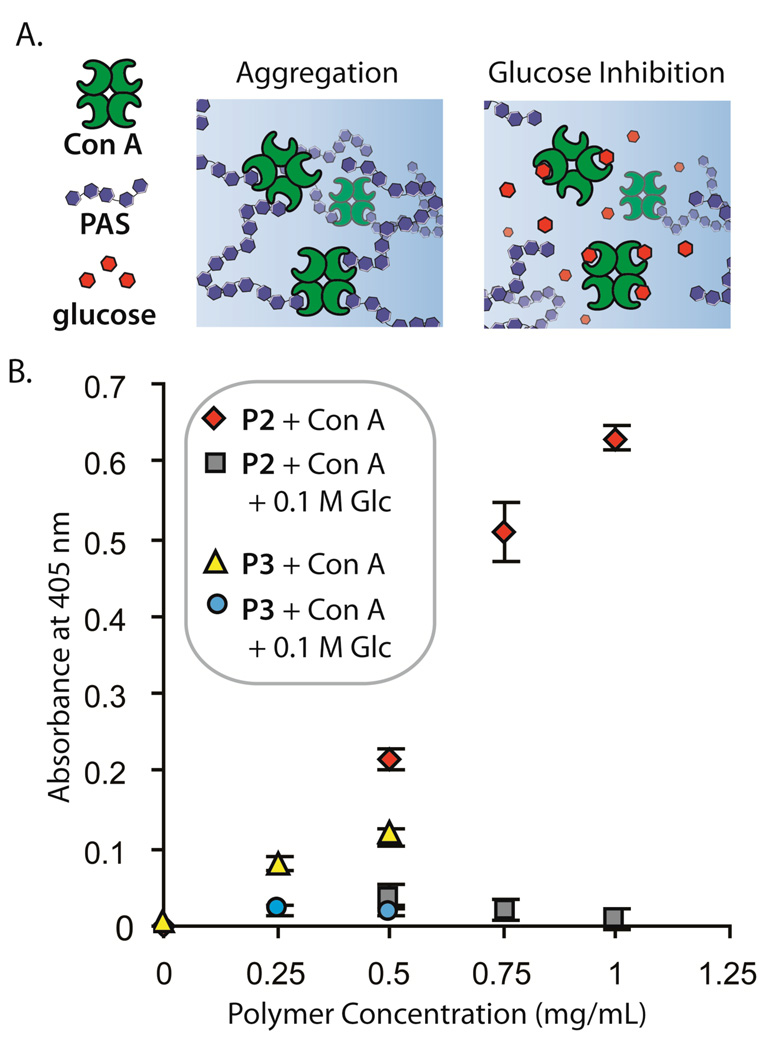
Figure 7.
Concanavalin A binding. (a.) Schematic representation of the binding of the lectin concanavalin A with PASs. (b.) The turbidity was measured based on the scattering at 405 nm for samples of P2 and P3 in the presence of Con A and with Con A and 0.1 M glucose. [Con A] = 1 mg/mL; Tris buffer, pH = 7.2; each data point is the average of three samples and error bars show 1 standard deviation.

