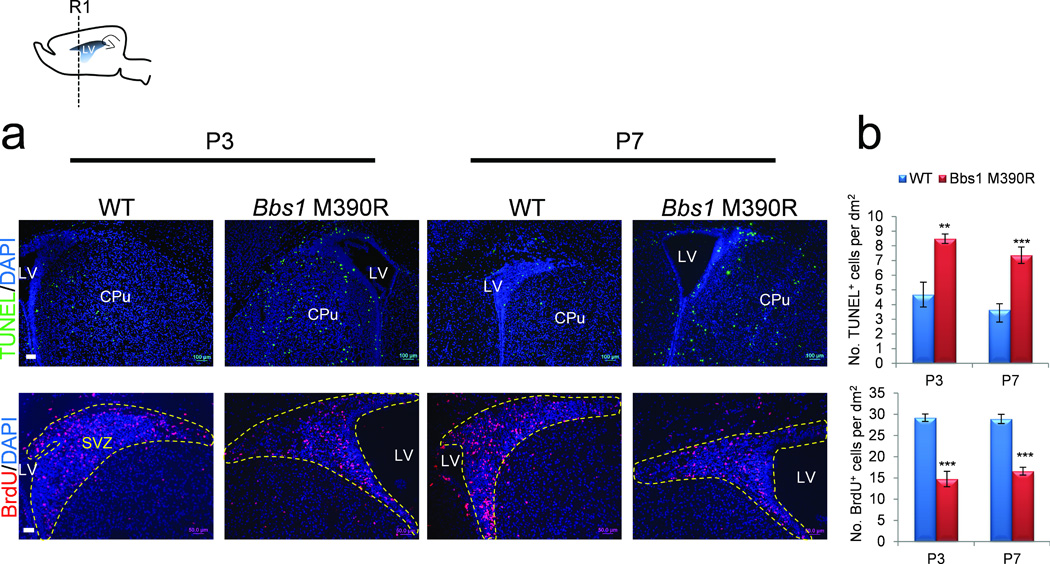
Figure 2.

Increased apoptosis and reduced proliferation in the brains of Bbs1M390R/M390R mice. Top left, cartoon depicting the sagittal section of a mouse brain showing the region of subsequent analyses (R1). (a) Representative immunofluorescent images and (b) the quantitation of cells labeled with TUNEL (top row) or BrdU (bottom row) per area in P3 and P7 WT and Bbs1M390R/M390R brains in at least 3 mice per group and genotype (dotted yellow line outlines SVZ). All error bars represent means ± s.e.m. *P<0.05, **P<0.005, ***P<0.0005, results from unpaired t tests. Scale bars equal 100 µm (a, top) and 50 µm (bottom). CPu, caudate putamen; LV, lateral ventricle; NS, not significant; P, postnatal day; SVZ, subventricular zone.
