
Figure 5.
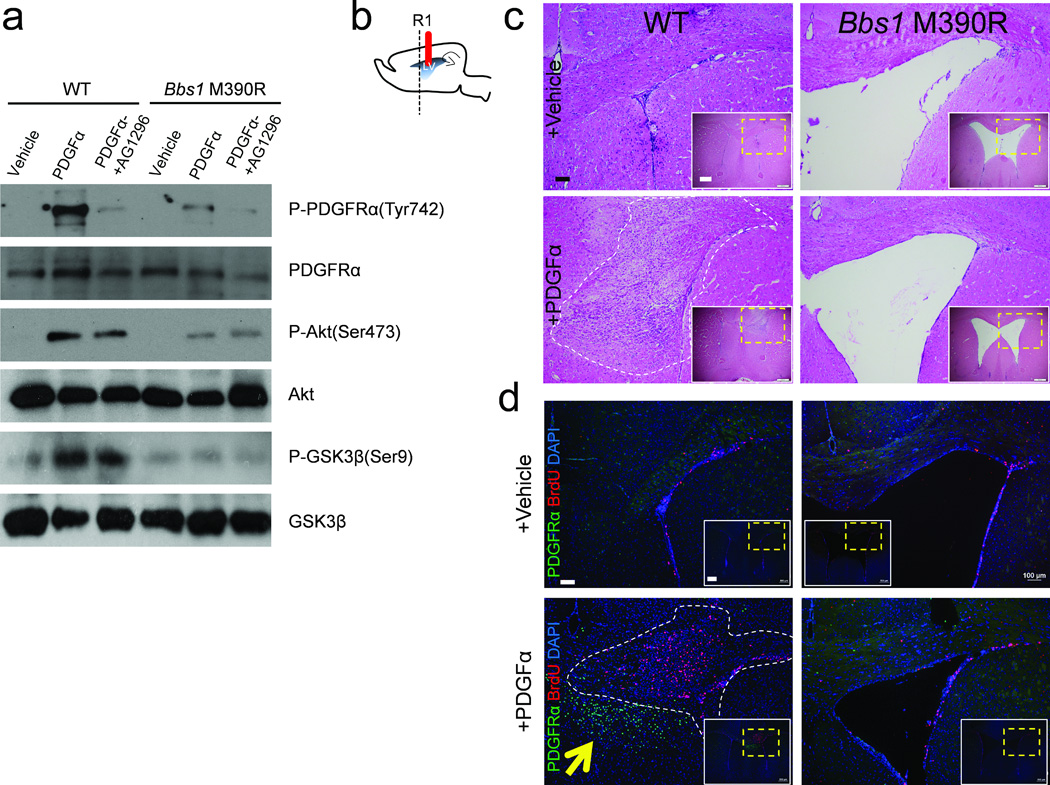
PDGFRα signaling is impaired in BBS. (a) PDGFα stimulation activates downstream signaling in primary oligodendrocytic precursor cells derived from WT but not Bbs1M390R/M390R brains. (b) Cartoon depicting the sagittal section of a mouse brain showing the cannula implantation site (solid red line) and the region of subsequent analyses (R1). (c) Representative histology of the ipsilateral brain hemisphere of vehicle infused WT (n=7) and Bbs1 KI (n=7); and PDGFα infused WT (n=7) and Bbs1M390R/M390R (n=7) mice (bottom). White panels show a low magnification image with the region of interest outlined by the yellow dotted line. (d) Representative immunofluorescent images of the ipsilateral infused hemisphere showing cells labeled with BrdU and PDGFRα in vehicle infused WT (n=3) and Bbs1M390R/M390R (n=3); and PDGFα infused WT (n=3) and Bbs1M390R/M390R (n=3) mice. The yellow arrow highlights the hyperplastic nodule consisting of PDGFRα+ cells and the white dotted line outlines the hyperplastic nodules observed in PDGFα infused WT mice. Scale bars equal 100 µm (larger image) and 500 µm (c, inset) and 100 µm (larger image) and 500 µm (d, inset).