
Figure 6.
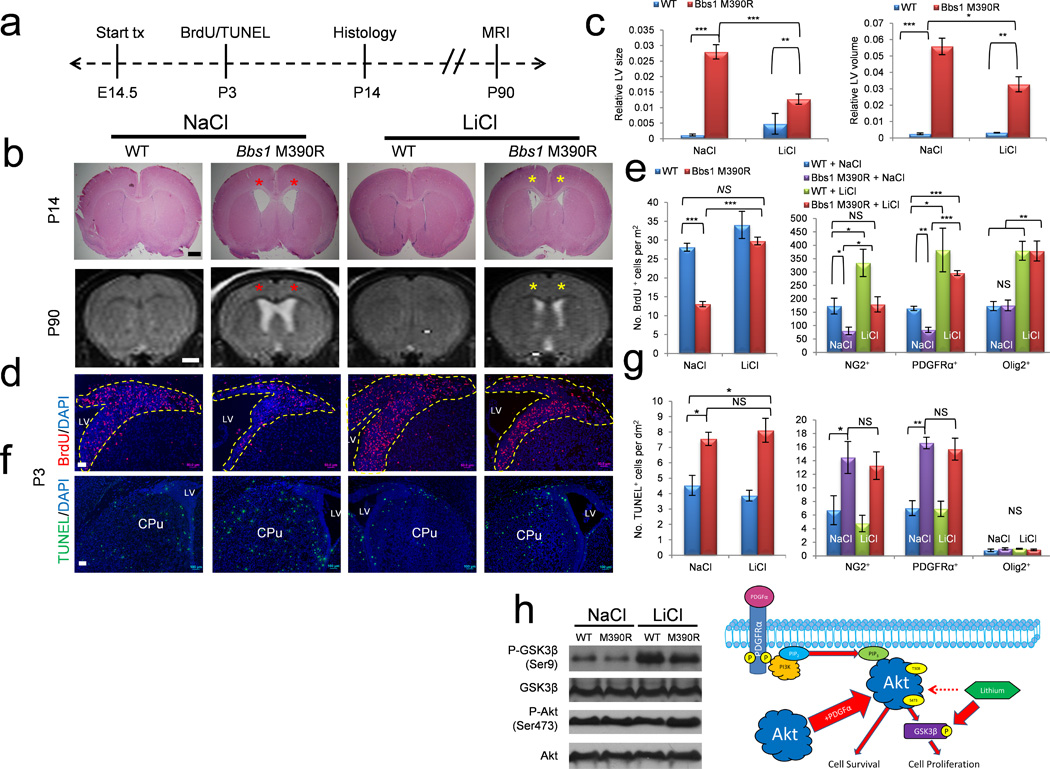
Lithium therapy rescues cell proliferation and hydrocephalus in Bbs1M390R/M390R mice. (a) Overview of the experimental timeframe. (b) Top row, representative histology plus quantitation (c, left) and representative MRI scans (bottom row) plus quantitation (c, right) of NaCl and LiCl treated WT and Bbs1M390R/M390R mice. Red asterisks highlight dilated lateral ventricles and yellow asterisks highlight reduced ventricle size following LiCl treatment in Bbs1M390R/M390R mice. (d,e) Representative immunofluorescent images of BrdU labeled cells in NaCl and LiCl treated mice (d) and quantitations (e, left). (e) Right, quantitation of BrdU labeled cells that also express NG2, PDGFRα or Olig2. (f,g) Representative immunofluorescent images (f) and quantitation (g, left) of TUNEL labeled cells in NaCl and LiCl treated mice. (g) Right, quantitation of TUNEL labeled cells expressing NG2, PDGFRα or Olig2. (h) Left, representative western blots of cortices from P3 NaCl and LiCl treated WT and Bbs1M390R/M390R mice. Right, drawing depicting the proposed mechanism of lithium’s effect on cell proliferation in treated WT and Bbs1M390R/M390R mice. Lithium increases phosphorylation of GSK3β leading to an increase in cell proliferation. We found no effect on the phosphorylation of AKT in contrast to previously reported results44. Error bars represent means ± s.e.m. *P<0.05, **P<0.005, ***P<0.0005, results from unpaired t tests. All experiments utilized ≥ 3 mice per group and genotype. Scale bars equal 500 µm (top, b) and 1 mm (bottom, b), 50 µm (d) and 100 µm (f). CPu, caudate putamen; E, embryonic day; LV, lateral ventricle; NS, not significant; P, postnatal day; SVZ, subventricular zone.