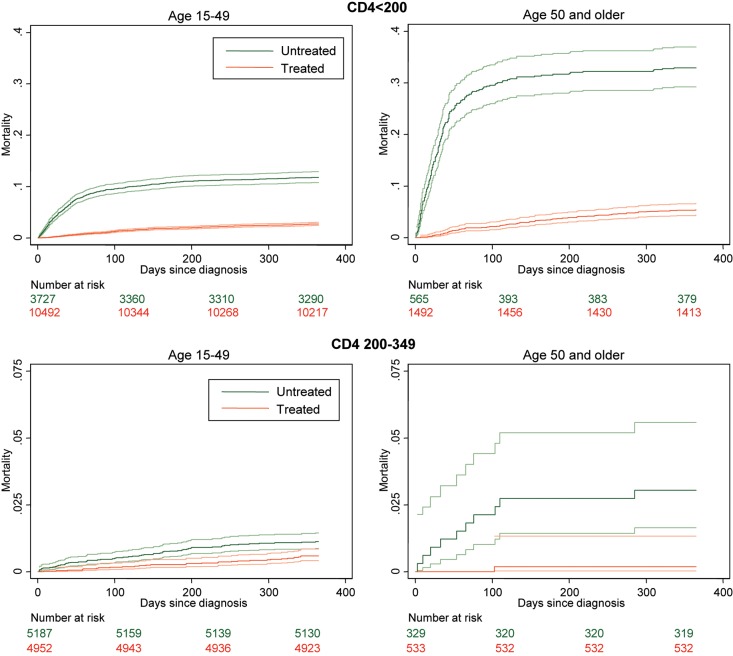
Figure 1.
Short-term mortality according to CD4 count at diagnosis and ART use. Each mortality curve is presented with upper and lower 95% confidence intervals. Upper panel shows mortality outcomes in the first year from diagnosis when CD4 <200, according to ART use. Lower panels show the same for CD4 200–349. Note the range on the y-axis is different (CD4 <200 from 0 to 0.4; CD4 200–349 from 0 to 0.15).

