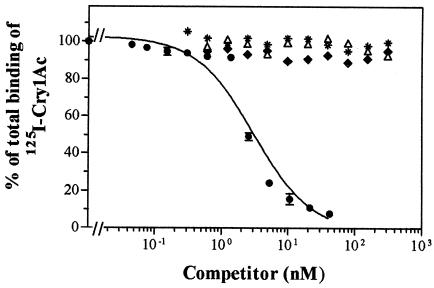
FIG. 3.
Binding of 125I-Cry1Ac at increasing concentrations of Cry1Ac (•), Cry1Fa (▵), Cry2Ab (✽), and Cry9Ca (⧫) to BBMV from the laboratory population. The homologous competition curve is the same as in Fig. 1 and 2 and is displayed here as a reference. Heterologous data with Cry1Ba, Cry1Ca, Cry1Da, and Cry2Aa are not shown, but they were essentially similar to those displayed.

