
Figure 4.
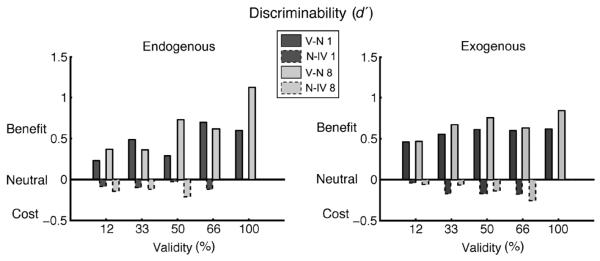
Discriminability differences. Average discriminability differences (in d′ units) for set sizes 1 (dark gray bars) and 8 (light gray bars) as a function of cue validity for endogenous (left) and exogenous (right) conditions. Benefits (solid line bars) are differences between valid and neutral cue asymptotes while costs (dashed line bars) are differences between invalid and neutral invalid cue asymptotes. Benefits significantly increase with validity for both set sizes in endogenous conditions (left panel) while both benefits and costs remain constant across cue validity for exogenous conditions (right panel).